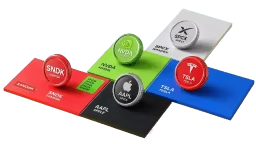
2026 Crypto TradFi Landscape Report: How Competition Evolves Under Explosive Growth? | RootData Research

 Prefer us on Google


Author: RootData
Introduction
In 2026, TradFi assets are becoming a new battleground for crypto exchanges.
As precious metals like gold and silver, along with global stock markets such as the US and South Korea, become increasingly active, more crypto exchanges are shifting TradFi products from peripheral business to core product lines. Assets that could only be traded through traditional brokers and financial markets are now entering crypto trading platforms through tokenized assets and perpetual contracts.
Crypto exchanges are also leveraging this to open up new growth spaces, breaking the long-standing cyclical constraints of the crypto market, making TradFi a new competitive variable for major exchanges.
In this context, RootData will observe the current development of TradFi in the crypto market from multiple dimensions, including market size, trading structure, exchange competition, and the core segment of stock derivatives (contracts).
This report is based on statistical data from the TradFi sectors of several leading exchanges, including Binance, Hyperliquid, OKX, Gate, and Bybit, focusing on tokenized asset-related contracts and spot trading, excluding real stock trading by traditional brokers. Given that the liquidity and users of current TradFi trading are still highly concentrated on leading crypto trading platforms that have launched this category, selecting these core platforms for horizontal comparison can better reflect the scale, structure, and competitive landscape of the current crypto TradFi market.
I. Overview of the Crypto TradFi Track
1. Cumulative Trading Exceeds $1.3 Trillion in H1 2026, Entering Explosive Growth Phase
In the first half of 2026, the crypto TradFi track has transitioned from "marginal trial" to "explosive growth" phase. The sample data from leading mainstream exchanges in H1 2026 has surpassed $1.3 trillion, while the total trading volume for the entire year of 2025 in the TradFi track was only in the hundreds of billions. The trading volume for just the first half of 2026 is already ten times that of the entire last year.
This growth is attributed to the early layout of crypto exchanges in TradFi and the resonance with the traditional financial market trends.
Since 2025, mainstream platforms represented by Binance, OKX, and Gate have continuously increased their TradFi product lines, completing the early layout of infrastructure. With strong performances in global stock markets such as precious metals and US and South Korean stocks this year, exchanges that have preemptively laid out crypto TradFi have captured substantial spillover demand and benefits from the traditional financial market.
From a monthly trend perspective, January's trading volume was $67.94 billion, with market focus still on precious metal tokens, and the spot trading accounted for 7.48%, reflecting a brief heat of precious metal RWA at the beginning of the year. Starting in February, the TradFi trading volume surged by 125.2% month-on-month to $152.99 billion, breaking the $100 billion mark; in June, it again grew by 72.5% month-on-month to $430.48 billion, setting a new high for the first half of the year.
June's single-month trading volume reached 6.3 times that of January, with the average monthly trading center moving from less than $70 billion at the beginning of the year to over $400 billion. If the second half of the year maintains the level of the first half, the annual trading volume of the TradFi track is expected to reach around $3 trillion.
2. Derivatives Dominate the TradFi Track
In the first half of 2026, contracts dominated the TradFi track, with a cumulative trading volume exceeding $1.3 trillion, accounting for 98.59%, making it the absolute main force of the TradFi track; spot trading was only $18.558 billion, accounting for less than 1.5%. The spot trading accounted for 7.48% in January, the highest for the first half of the year, and then quickly dropped below 2% and remained low, establishing a dominant contract pattern from February onward.
Among them, stock derivatives are dominant. In terms of asset coverage, the five major exchanges have launched TradFi contract targets, with over 90% being stocks and stock ETFs. From the position data in the first half of 2026, the position sizes of popular TradFi assets represented by SNDK, SPCX, SK Hynix, and XAU are also growing significantly, with the XAU gold contract OI once exceeding $700 million and SPCX OI peaking over $500 million.
II. Current Competitive Landscape of Crypto Exchanges in TradFi
1. Trading Volume Share: From Binance's "Dominance" to Multi-Tier Competition
The flow concentration in the TradFi track is undergoing structural changes. From January 2026 to August 24, the cumulative data shows that the total trading volume of TradFi from five exchanges is approximately $1.90 trillion, with Binance leading at $1.29 trillion, holding a 68.3% share, still the absolute leader. However, when viewed from a monthly perspective, Binance's share has gradually decreased from 78.8% in January to 58.2% in August, a decline of over 20 percentage points.
Meanwhile, the second tier is rapidly expanding. OKX, which had almost no TradFi transactions at the beginning of the year, has gradually increased to 18.2% in August, rising to second place; Hyperliquid rose to 10.7% in May and maintained above 10%, peaking at 13.3% in July; Gate's share fluctuated between 3.7% and 13.5%, rebounding to 10.7% in August; Bybit also climbed from 0.3% to 3.0%. This indicates that the funds in the TradFi track are no longer concentrated on a single platform but are showing a clear trend of multi-polar diversion.
2. Position Accumulation: Differentiation in User Trading Behavior Across Platforms
As of August 24, the five exchanges' average daily OI for TradFi contracts is approximately $7.304 billion. Binance ranks first with $3.455 billion, accounting for 47.3%; Hyperliquid ranks second with $1.956 billion, holding 26.8% share; Gate's average daily OI is about $903 million, ranking third with 12.4%; OKX and Bybit are at 8.0% and 5.6%, respectively.
Hyperliquid's OI share (26.8%) is significantly higher than its trading volume share (approximately 9.9%), indicating that its unit trading volume can accumulate positions far more than other platforms; Gate's OI share (12.4%) is also higher than its trading volume share (10.7%). In contrast, OKX's trading volume share (18.2%) is significantly higher than its OI share (8.0%). This discrepancy indicates that different platforms have fundamentally different "uses" for TradFi assets, with some leaning towards high-frequency trading and others towards position accumulation.
3. Significant Differences in Asset Coverage Reflect Different Platform Expansion Strategies
As of the latest data on August 24, the number of TradFi assets across the five exchanges shows a polarized distribution. Gate has reached 1,022 assets, with OKX in second place at 242 assets and Binance in third at 229 assets. Gate's coverage is 4.2 times that of the second-place OKX, showing a very clear gap.
This magnitude difference also reflects two distinctly different platform strategies. Gate follows a "broad coverage" route, with the most comprehensive asset launch range, covering multiple global mainstream stock markets such as US, Hong Kong, South Korea, and Japan, and its launch speed is relatively fast, meeting cross-market and multi-theme allocation needs by quickly listing a large number of targets; while Binance, OKX, Hyperliquid, and Bybit adopt a "curated" strategy, controlling the number of targets within the range of 100-250, focusing more on market making and liquidity investment in core assets.
III. How is the Stock Derivatives Market Evolving?
Stock derivatives, which dominate trading volume, are currently the most worthy segment to observe. RootData's ranking of stock derivatives exchanges discards the sole focus on trading volume and provides a comprehensive score based on trading volume, open interest, spreads, depth, trading costs, and data collectability across various dimensions.
From the data in August (up to the 24th), in terms of comprehensive scoring, Binance ranks first with 95.7 points, while Gate and OKX both score 92.2 points, tying for second place, Hyperliquid closely follows with 92.1 points, and Bybit scores 85.4 points. Below are the data situations for each exchange across various dimensions.
1. Trading Volume Pattern: Differentiation of "One Dominant, Many Strong" and Growth Momentum
Trading volume remains the most intuitive measure of market position. Binance leads with an average daily trading volume of $14.927 billion, 4.1 times that of the second-place OKX ($3.621 billion), occupying an absolute dominant position, with the industry showing a typical "one dominant, many strong" pattern. OKX and Hyperliquid rank second and third, with average daily trading volumes of $3.621 billion and $3.067 billion, respectively, at the same level; Gate's average daily volume is $1.879 billion, and Bybit's is $0.918 billion.
However, the trading volume figures are just one side of the story; the month-on-month growth rate also reveals trends in capital flow. From February to August, the average daily trading scale showed that the industry peaked in growth rate in June, followed by a digestion period in July and August due to a "high base" effect. Against this backdrop, the growth momentum of various platforms has shown significant divergence.
As the absolute leader, Binance achieved an average daily month-on-month growth rate of 467.9% in June, which fell to 116.5% in July and further dropped to 2.1% in August (as of the 24th). While both volume advantages and growth pressures coexist, the volume advantage remains solid. Hyperliquid also exhibited a pattern of high followed by low, while OKX and Bybit maintained positive growth, although their growth rates have significantly narrowed from the peaks in May and June. Gate's growth curve has followed an independent rhythm, continuously gaining momentum since May, with average daily month-on-month growth rates of 124.1%, 187.3%, 323.7%, and 261.1% from May to August, maintaining triple-digit high growth for four consecutive months. Whether this sustained high growth can translate into further leaps in market ranking remains to be observed in the coming months, considering the base effect and capital retention.
2. Position Structure: Divergence of Long and Short Strategies
In terms of positions, Binance leads with an average daily open interest of $3.472 billion, followed closely by Hyperliquid at $1.986 billion, reaching 57% of Binance's volume. Gate ranks third with an average daily open interest of $772 million, while OKX and Bybit have $532 million and $194 million, respectively.
The OI/trading volume ratio across different platforms shows a clear divergence in user behavior. Hyperliquid has a ratio of about 0.65, indicating that users tend to hold positions long-term, reflecting typical allocation characteristics; Gate's ratio is about 0.41, showing a relatively balanced long-short strategy; while OKX has a ratio of about 0.15 and Binance about 0.23, both leaning towards high-frequency short-term trading. For TradFi assets like stock derivatives, the depth of position retention often reflects user stickiness more than trading pulses, with platforms that maintain long positions typically exhibiting lower churn rates and higher capital retention efficiency.
3. Market Depth: Gate Ranks First in Liquidity Mid-August, Surpassing Binance for 11 Consecutive Trading Days
According to liquidity monitoring data, since August 14, Gate's ±2% weighted depth has surpassed Binance for 11 consecutive trading days, ranking first in the industry. During this period, Gate's average daily weighted depth reached $14.678 million, while Binance's was $10.721 million.
If we consider a more realistic trading range with ±1% weighted depth, Gate also maintained the top position after August 10, with an average daily depth of $7.4986 million. Together, Gate and Binance accounted for about 71% of the liquidity share among comparable exchanges, further highlighting the concentration effect at the top of the industry.
Prior to this, the industry overall exhibited a "dual-head concentration" pattern, with Binance maintaining a long-term lead with an average daily ±2% weighted depth of $10.0691 million, followed closely by Gate at $9.0123 million, together accounting for over 70% of the industry's depth; OKX, Bybit, and Hyperliquid followed with $4.0445 million, $1.7886 million, and $1.1713 million, respectively, showing a significant gap with the leading platforms.
4. Price Spread Levels of Leading Exchanges Remain Stable
Transaction costs are also an important factor affecting trading experience. OKX has the lowest weighted spread at 0.0091%, followed by Hyperliquid at 0.0106%. Binance (0.0117%) and Gate (0.0121%) are nearly at the same level, ranking third and fourth, while Bybit trails with 0.0298%. Overall, the spreads of leading exchanges are relatively stable. Notably, Gate's spread has significantly narrowed since August 18, maintaining a range of 0.0043% - 0.0086% for five consecutive days, the best in the market.
5. Variety Matrix: Who is "Stocking Up" and Who is "Breaking Through"?
When transaction costs are compressed to the extreme, the number of assets a platform can offer becomes the next competitive dimension. Snapshot data from August 24 shows that Gate ranks first with 366 stock derivative assets, followed by Bybit (206), Binance (170), OKX (156), and Hyperliquid (116). Expanding the view to CFDs, by Q2 2026, Gate has launched 663 trading assets in CFDs, with a peak weekly trading volume exceeding $150 billion, also ranking among the top globally in crypto platforms.
However, the number of varieties is only one aspect of coverage capability; the other aspect is the actual share in popular assets. Taking four leading assets—SNDK, SK Hynix, MU, and SPCX—as examples, according to the tokenized asset data from RootData on August 24, the competitive rankings of each platform show distinct differences.
Binance is the absolute center of traffic and volume. It ranks first in 24-hour trading volume for all four assets and takes three firsts in open interest. However, its lead is concentrated in "volume," with spreads and leverage advantages not being significant; most asset spreads are only in the second tier, and its depth advantage on storage chain stocks has even been surpassed.
Among the four assets, Gate has the lowest spreads across the board, with SNDK at 0.0007%, SK Hynix at 0.0009%, and the maximum leverage offered at 75 times for three of the assets. More importantly, the main support depth for SK Hynix has a ±2% liquidity depth of $2.45 million, which is 5.9 times that of Binance and 4 times that of Bybit; MU's depth of $6.5 million ranks first among the five, leading Hyperliquid by 19% and Binance by 51%.
Hyperliquid, on the other hand, has ample depth but lacks a significant advantage in spreads. SNDK's depth of $7.72 million ranks first in the market, and MU's depth is second, with open interest topping on MU, but spreads on SNDK and MU are noticeably wider.
6. Multi-Dimensional Radar: Horizontal Comparison Summary
From the six-dimensional ranking, the current landscape of stock derivative exchanges shows a clear differentiated distribution.
Binance ranks first in comprehensive scoring, average daily trading volume, average daily open interest, and average daily ±2% weighted depth, making it the main bearer of liquidity in stock derivatives, holding an irreplaceable central position among broad-based assets.
Gate ranks second in comprehensive scoring, second in average daily ±2% weighted depth, and first in asset quantity with 366 assets, showing the highest month-on-month growth in July and August among the five, demonstrating active performance in coverage breadth and growth momentum.
OKX ranks second in comprehensive scoring, with the lowest average spread of 0.0091% among the five, excelling in transaction cost dimensions, making it attractive to traders who value quote quality.
Hyperliquid ranks second in average daily open interest, also performing well in spread control, but its average daily depth is relatively lower, reflecting its platform characteristics of longer holding periods and lower trading frequency, overall presenting a style of "high retention, low turnover."
Bybit ranks second in asset quantity, while its other dimensions are between fourth and fifth, showing a gap in overall volume compared to leading platforms, and its layout in the stock derivative niche is still in the expansion stage.
Conclusion
By 2026, TradFi assets have rapidly grown from a marginal category to a core track with monthly trading volumes in the hundreds of billions of dollars. In the first half of the year, the cumulative trading volume of TradFi assets on crypto exchanges reached $1.3 trillion, marking the accelerating dissolution of boundaries between crypto platforms and traditional financial markets.
The exchange landscape is also evolving in parallel. Binance remains the absolute center of traffic and volume, but its trading volume share has dropped from 78% at the beginning of the year to less than 60% in August, indicating a shift from "unipolar concentration" to "multipolar diversion" in the market. OKX has rapidly gained volume through low trading costs, while Hyperliquid attracts long-term funds with high position retention, establishing barriers on both the cost and allocation fronts. Gate is a variable worth continuous observation in this landscape; while its overall volume lags behind Binance, its operational level is relatively balanced, and its recent growth rate is relatively leading. In certain niche assets, its liquidity depth and spreads have already shown competitive strength.
Looking ahead to the second half of the year, the competitive logic in the TradFi track is shifting from who has greater volume to who can provide better quotes and deeper market depth on core assets across multiple comprehensive experience dimensions. Platforms that can position themselves early will be more likely to capture the next round of growth.
-- Price
This content is provided for general informational purposes only and doesn't constitute financial, investment, legal, or tax advice. Any events, rewards, online promotions, or related information mentioned herein should not be considered a recommendation, solicitation, or invitation to purchase, sell, trade, or otherwise deal in any crypto assets. Crypto assets are highly volatile and may result in loss. The availability of WEEX services, products, and related events may vary by region. You are responsible for ensuring that your participation is in accordance with applicable local laws and regulations.
You may also like
USDe: Ethena Turns to Wall Street to Boost Returns

Robinhood Surge: Why UNI is Rising
How short liquidations cleared $500B in crypto positions before institutional buyers took over

Analyzing 43,000 Hyperliquid Accounts: Unveiling the Profit Systems of 12 Top Traders
Latest Holdings of AllianceDAO and FOMO Founders: 70% in US Stocks, Only BTC and Zcash in Crypto
Token Unlocks Begin, Hyperliquid, Sui, and Ethena Stand Out
INDODAX Volume Rises to Rp8.7 Trillion in August 2026

CME launches crypto indexes tracking XRP, SOL, HYPE and other altcoins
Hyperliquid in Talks with Kraken's Parent Company Payward for U.S. Expansion
Every Major Correspondent Bank Will Support Stablecoin Tracks in Ten Years
Renewed Clashes After a Month of Silence: Why the US-Iran Conflict Resumed and How the Market Reacted?

Former SEC and CFTC Officials Warn the U.S. May Miss Out on $90 Trillion Perpetual Contract Market

Lazarus moves $30M through Hyperliquid as US talks advance

What would it take to bring Hyperliquid to the US? Former SEC counsel explains
Former SEC, CFTC Officials Urge Lighter Touch to Bring Crypto Perps Trading Onshore

HyperLend Co-founder States It Will Not Exit the Market and Will Support Stock and Other Collateral Types

Derivatives Begin to Drive Spot Markets: South Korea's Asset Pricing Power is Flowing Out

HYPE faces $36M team withdrawal on September 6
Crypto Projects Buy Back Nearly $640 Million in Tokens This Year, Hyperliquid and pump.fun Account for 90%
68 DeFi Protocols Activate Fee Redistribution Structure

The Battle of HIP-4 Begins: Who Will Become the New trade.xyz?

Observation of Six Positions Exceeding $100 Million in Hyperliquid
Crypto Market Makers Profit from Basis Trading Amid Bitcoin Rebound
realtrumpcoins Collaborates with Authorities for Investigation, Robinhood Chain DEX Trading Volume Reaches $945 Million
Ethena Perpetual Equity Contracts: Ethena Seeks New Yield for USDe in Perpetual Equity Contracts
Follow the Money: $2 Billion for Strategy, YZi Labs Incubator, and DeFi Dominance

Hyperliquid On-Chain Wallet Monitoring Page Released

Holder Revenue Reaches $12.938 Million, Emerging as a Benchmark in the DeFi Market
HyENA shuts down after processing $4B in trades
Hyperliquid Traders Exceed 400,000
USDe: Ethena Turns to Wall Street to Boost Returns
Robinhood Surge: Why UNI is Rising
How short liquidations cleared $500B in crypto positions before institutional buyers took over
Analyzing 43,000 Hyperliquid Accounts: Unveiling the Profit Systems of 12 Top Traders
Latest Holdings of AllianceDAO and FOMO Founders: 70% in US Stocks, Only BTC and Zcash in Crypto
Token Unlocks Begin, Hyperliquid, Sui, and Ethena Stand Out