BTC Price Today: Will Bitcoin Hold $58,000 or Break Lower?


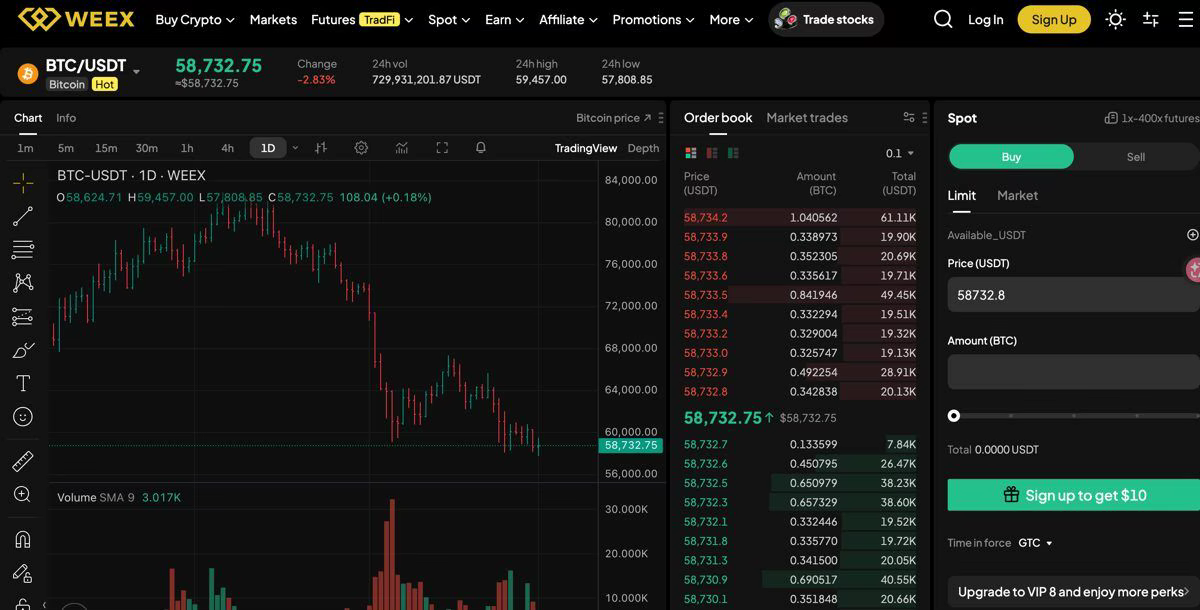
Bitcoin is trading near $58,732.75 on the BTC/USDT spot market after a 2.83% 24-hour decline. The latest WEEX market view shows 24-hour volume around 729,931,201.87 USDT, with BTC moving between a low of $57,808.85 and a high of $59,457.00.
The short-term setup is defensive. BTC is hovering above the $58,000 support area, but the daily chart still shows sellers controlling the broader move after a sharp decline from higher levels. Users who want to follow Bitcoin markets directly can create a WEEX account and monitor the BTC/USDT spot market as price tests the next support zone.
BTC Price Snapshot: Support and Resistance Near $58,000
| Item | Current read | Why it matters |
|---|---|---|
| Spot price | $58,732.75 | BTC is trading just above the key $58,000 support area |
| 24h change | -2.83% | Shows strong short-term selling pressure |
| Support zone | $57,808.85 to $58,000 | First area buyers need to defend |
| Resistance zone | $59,457 to $60,000 | First area buyers need to reclaim cleanly |
| Market bias | Bearish with possible short-term range behavior | BTC needs a reclaim of $60,000 to improve momentum |
| Next key level | $60,000 / $57,800 | Upside and downside levels to watch next |
Why Is Bitcoin Price Falling Today?
BTC price is being shaped by renewed selling pressure, weak follow-through above $60,000, and a test of the lower side of the recent range. The 2.83% decline shows that sellers are still active, even though Bitcoin remains above the 24-hour low.
The daily chart also keeps the setup cautious. BTC has been moving lower from the $80,000 area shown on the chart, then failed to build a lasting recovery above the mid-range. That makes the $57,808.85 to $58,000 area the first major line for bulls to defend.
BTC Price Forecast: Can Bitcoin Reclaim $60,000?
A recovery path for BTC starts with holding the $57,808.85 to $58,000 support band. If buyers defend that zone and push Bitcoin back above $59,457, the next test would be around $60,000. A stronger move through $60,000 could bring $61,500 and $62,500 back into focus.
For now, the recovery case needs confirmation. BTC needs sustained buying above $60,000, not only a brief bounce from support. Traders should watch whether price can form higher lows and whether volume improves during any push above resistance.
What Happens If BTC Loses $58,000 Support?
The bearish case becomes stronger if Bitcoin loses the $57,808.85 support level. A clean break below that area would suggest that the current support test failed and could expose lower liquidity zones.
If $57,800 breaks, traders may start watching $56,000 first, followed by $55,000 as a larger downside area. Another drop could also develop if BTC repeatedly fails near $59,457 to $60,000, because failed resistance tests often invite more short-term selling.
Bitcoin Support and Resistance Levels to Watch
| Level | BTC price zone | Why it matters |
|---|---|---|
| Immediate support | $57,808.85 to $58,000 | Recent low area and first zone buyers need to defend |
| Near-term resistance | $59,457 to $60,000 | Recent 24-hour high and major psychological resistance |
| Bullish extension | $61,500 to $62,500 | Potential upside area if BTC reclaims $60,000 with volume |
| Breakdown watch | Below $57,808.85 | Would weaken the range and confirm renewed selling pressure |
BTC Market Data: Volume, Highs, and Lows
| Metric | Current reading | Trader focus |
|---|---|---|
| Spot price | $58,732.75 | Whether BTC can hold above $58,000 |
| 24h change | -2.83% | Shows strong short-term selling pressure |
| 24h high | $59,457.00 | First level buyers need to reclaim |
| 24h low | $57,808.85 | Key support for the current move |
| 24h volume | 729,931,201.87 USDT | Watch whether volume rises during a breakdown or recovery attempt |
BTC Technical Analysis: Momentum and Volume
| Indicator | Current read | What traders should watch |
|---|---|---|
| MACD | Not confirmed from the screenshot | Watch for momentum improvement before trusting a larger recovery |
| RSI | Not confirmed from the screenshot | Check whether BTC is stabilizing or still weakening near support |
| Major support | $57,808.85 to $58,000 | Loss of this zone would favor sellers |
| Major resistance | $59,457 to $60,000 | Break above this zone would improve the short-term setup |
Bitcoin Trading Scenarios: Rebound or Breakdown?
| Scenario | Trigger | Possible BTC reaction |
|---|---|---|
| Bullish rebound | BTC holds $58,000 and reclaims $60,000 | Price may retest $61,500 to $62,500 if volume supports the move |
| Range-bound trade | BTC stays between $57,808.85 and $60,000 | Short-term traders may focus on support and resistance reactions |
| Bearish breakdown | BTC loses $57,808.85 | Price could test $56,000 or $55,000 as sellers regain control |
What This Means for BTC Traders
BTC is under pressure, and the $58,000 area is the immediate decision point. Spot traders may prefer waiting for a clean reclaim of $60,000 before treating the move as a recovery, or watching for a stronger reaction near $57,800 before considering dip entries.
Risk control matters because Bitcoin can move sharply around major psychological levels. Traders should avoid chasing one candle, watch order execution around $58,000 and $60,000, and size positions according to the risk of a break below support.
How to Trade Bitcoin on WEEX: Step by Step Guide
- Step 1: Go to the WEEX official website and create your WEEX account.
- Step 2: Deposit funds by transferring crypto from your wallet or buying through WEEX Quick Buy.
- Step 3: Go to the spot section and search for the BTC/USDT trading pair.
- Step 4: Enter the amount of BTC you want to buy or sell and place your order.
- Step 5: Secure your Bitcoin. You can move BTC to your own wallet or keep it on WEEX only for active trading.
Bottom Line
Bitcoin is bearish in the short term while it trades below the $59,457 to $60,000 resistance zone. BTC still has a chance to stabilize if buyers defend $57,808.85 to $58,000, but a clean break below that area would increase downside risk. A move back above $60,000 would be the first sign that buyers are regaining control.
Before you go: you can learn about the WEEX Token (WXT) for ecosystem participation, and new users may explore the WEEX welcome bonus with limited-time rewards such as trading coupons and task-based incentives.
FAQ
1. What is Bitcoin price today?
Bitcoin is trading near $58,732.75 on the BTC/USDT spot market, based on the latest WEEX market view in the screenshot.
2. Is BTC bullish or bearish right now?
BTC looks bearish in the short term because price is down 2.83% over 24 hours and remains below the $59,457 to $60,000 resistance zone.
3. What is the key support level for Bitcoin?
The main short-term support area is around $57,808.85 to $58,000. A break below that zone would weaken the current setup.
4. What resistance should BTC traders watch?
BTC traders should watch $59,457 first, followed by $60,000. A stronger move above $60,000 could improve the recovery setup.
5. Can Bitcoin recover from here?
Bitcoin can recover if buyers defend the $58,000 area and push price above $60,000 with stronger volume. Without that confirmation, the rebound risk remains limited.
6. Can I trade BTC on WEEX?
Yes. BTC/USDT is available as a spot market on WEEX, allowing users to buy and sell Bitcoin against USDT.
7. What should beginners watch before trading BTC?
Beginners should watch price support, resistance, volume, spread, liquidity, and broader market sentiment before entering a trade.
DISCLAIMER: WEEX and affiliates provide digital asset exchange services, including derivatives and margin trading, only where legal and for eligible users. All content is general information, not financial advice-seek independent advice before trading. Cryptocurrency trading is high risk and may result in total loss. By using WEEX services you accept all related risks and terms. Never invest more than you can afford to lose. See our Terms of Use and Risk Disclosure for details.
You may also like

What Is America250 Crypto? Why the USA250 Solana Meme Coin Pumped 1,400%
What is America250 crypto (USA250)? Learn why this Solana meme coin pumped 1,400%, how the July 4 snapshot works, realistic price targets, and key risks before you trade. (157 characters)
META Stock Price Prediction 2026: Can Meta Stock Hit $1,000 in July?
META stock price prediction 2026: Can Meta hit $1,000? Analyst targets, AI cloud pivot, and how to buy META stock on WEEX explained.
USER Crypto Price Prediction 2026: Can USER Crypto Reach $1?
Is USER a good investment? Learn what is USER crypto, current price at $0.00140, and realistic USER price prediction 2026. Energy-AI narrative token analysis.
Introducing Morpho ($MORPHO): Open Credit Network and Price Prediction
Morpho is an open credit network for onchain lending, drawing attention as Morpho Midnight and ecosystem integrations expand.
MU Stock Price Prediction 2026-2030: Can Micron Hit $4,000 as AI Memory Demand Explodes?
Can MU stock reach $4,000 by 2030? Get the latest MU stock price prediction 2026-2030, analyst targets, and learn how to buy MU stock today.
$SYN Airdrop on WEEX: Complete Guide to Synapse and Claim Free $SYN
Learn Synapse tokenomics, cross-chain governance utility, and how to claim free tokens in the WEEX 50,000 USDT SYN airdrop before July 8, 2026.
MSFT Stock Analysis 2026: Why Microsoft's 33% Drop Could Be a Generational Buying Opportunity?
Top 5 TradFi Assets to Trade in 2026: Are TradFi Assets Worth Investing?
Trade Tesla, Gold, Silver, Nasdaq & Nvidia on WEEX TradFi. Compare top TradFi assets, leverage options, and how to invest in TradFi assets with USDT.
What is NVIDIA(NVDA) Coin? Everything You Need to Know About NVDA/USDT Perpetual Futures on WEEX
NVIDIA (NVDA) Coin on WEEX refers to the USDT‑margined perpetual futures tracking NVIDIA Corporation’s stock price rather than…
What is NVIDIA(NVDA) Coin? Everything You Need to Know and How to Trade NVDA/USDT on WEEX
NVDA/USDT perpetual futures were newly listed on WEEX, with trading opened on July 2, 2026. This derivative tracks…
Can NVDA Reach $250 in 2026? NVDA Price Prediction
KEY TAKEAWAYS Current price: NVDA/USDT futures trade near $196.13 at publication time. Required move: around +27.5% is needed…
NVIDIA (NVDA) Price Prediction: July 2026 Forecast, Technical Levels, and Strategy
NVIDIA (NVDA) has become the bellwether for AI risk appetite, and traders can access its crypto-settled exposure via…
Sandisk Stock Price Prediction 2026–2030: Can SNDK Reach $3,000?
Bernstein set a $3,000 price target on Sandisk stock the day before it fell 10% to start Q3. At approximately $2,023 today, getting to $3,000 means roughly 48% appreciation. This guide examines what that path requires, what the bear case says, and what the realistic range of outcomes looks like through 2030.
What Is Sandisk and Why Did It Go From $40 to $2,000 in One Year?
Sandisk stock went from approximately $40 in early 2025 to over $2,000 in 2026, a gain exceeding 4,900% in roughly eighteen months. This guide explains what Sandisk actually is, why it was ignored for years, and what changed to produce one of the most extraordinary stock price moves in recent market history.
Sandisk Stock Falls 10% to Start Q3: Is the AI Memory Rally Finally Over?
Sandisk stock dropped approximately 10% on July 1, the first trading day of Q3, after surging over 720% in the first half of 2026. The selloff had nothing to do with the company's business. This guide examines what actually triggered the decline, whether it signals the end of the AI memory rally, and what investors should actually be watching.
What is Synapse(SYN) Coin? Everything You Need to Know for Cross‑Chain Trading and Investing
Synapse (SYN) is a cross-chain interoperability protocol enabling secure asset transfers, messaging, and smart contract calls across multiple…
SK Hynix Stock Price Forecast 2026–2027: Structural HBM Shortage Analysis
Expect a clear look at how the AI-driven memory cycle and a structural HBM bottleneck could shape SK…
Can SK Hynix Reach $2000 in 2026? SK Hynix Price Prediction
KEY TAKEAWAYS Current price: $1523, based on live market data today from major crypto trackers. Required move to…
What Is America250 Crypto? Why the USA250 Solana Meme Coin Pumped 1,400%
What is America250 crypto (USA250)? Learn why this Solana meme coin pumped 1,400%, how the July 4 snapshot works, realistic price targets, and key risks before you trade. (157 characters)
META Stock Price Prediction 2026: Can Meta Stock Hit $1,000 in July?
META stock price prediction 2026: Can Meta hit $1,000? Analyst targets, AI cloud pivot, and how to buy META stock on WEEX explained.
USER Crypto Price Prediction 2026: Can USER Crypto Reach $1?
Is USER a good investment? Learn what is USER crypto, current price at $0.00140, and realistic USER price prediction 2026. Energy-AI narrative token analysis.
Introducing Morpho ($MORPHO): Open Credit Network and Price Prediction
Morpho is an open credit network for onchain lending, drawing attention as Morpho Midnight and ecosystem integrations expand.
MU Stock Price Prediction 2026-2030: Can Micron Hit $4,000 as AI Memory Demand Explodes?
Can MU stock reach $4,000 by 2030? Get the latest MU stock price prediction 2026-2030, analyst targets, and learn how to buy MU stock today.
$SYN Airdrop on WEEX: Complete Guide to Synapse and Claim Free $SYN
Learn Synapse tokenomics, cross-chain governance utility, and how to claim free tokens in the WEEX 50,000 USDT SYN airdrop before July 8, 2026.