SOXL Price Today: Can Semiconductor Bull 3X ETF Hold $250 After 6.86% Rally?


SOXL Price Today: Can Semiconductor Bull 3X ETF Hold $250 After 6.86% Rally?
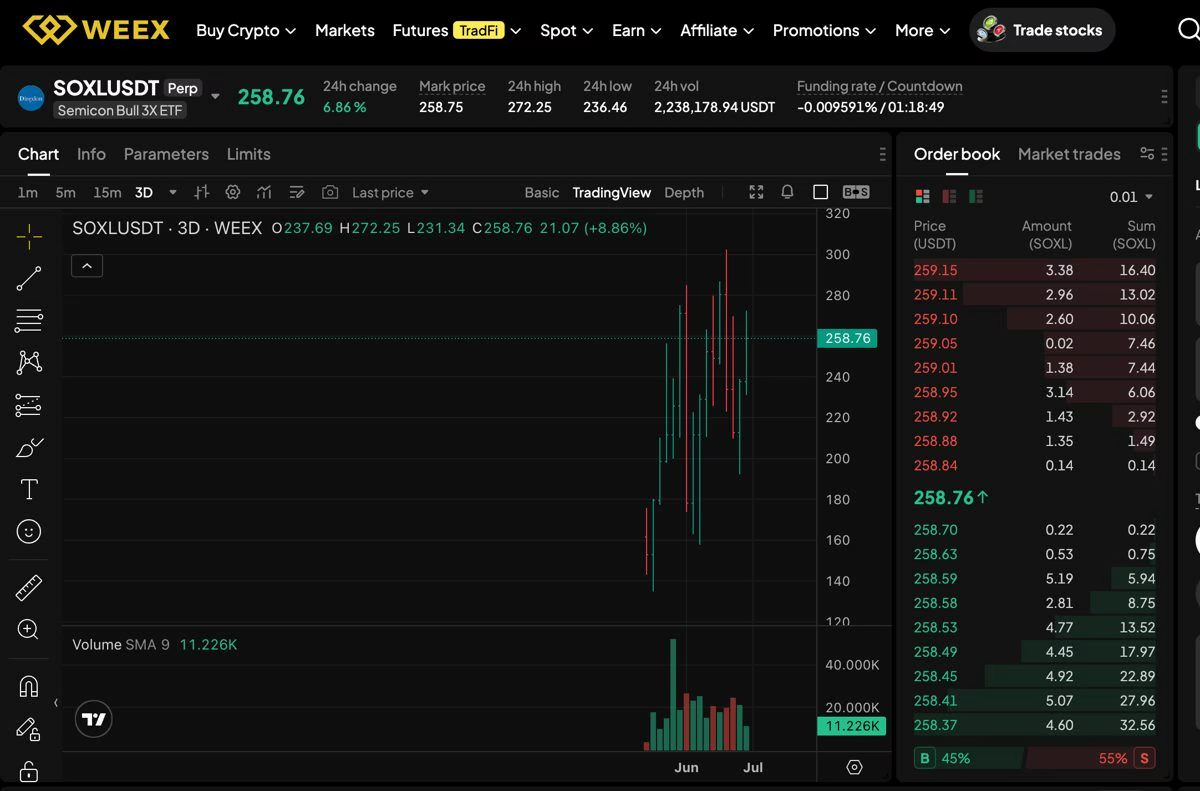
Direxion Daily Semiconductor Bull 3X ETF futures are back in focus after SOXLUSDT Perp moved to around $258.76, up 6.86% over 24 hours. The move gives bulls a stronger short-term setup, but the next question is practical: can SOXL hold the $250 area, or does the rally fade near the recent $272.25 high?
Traders who want access to listed markets can create a WEEX account and review SOXLUSDT futures on WEEX. SOXL is a leveraged semiconductor ETF product, and trading its perpetual futures is not the same as holding a normal stock or spot crypto asset.
SOXL Price Snapshot: Support and Resistance Near $258
SOXL is trading near $258.76, while the mark price is close at $258.75. That tight gap suggests the futures market is tracking the last traded price closely, but leverage, funding, and semiconductor-sector volatility can still make intraday moves sharp.
| SOXL market metric | Current reading | Why it matters |
|---|---|---|
| Last price | $258.76 | Shows where SOXLUSDT futures are trading now |
| 24h change | +6.86% | Confirms strong short-term momentum |
| 24h high | $272.25 | Main breakout level for bulls |
| 24h low | $236.46 | Key downside reference if support fails |
| Near support | $250, then $236.46-$240 | Areas traders may watch for pullback defense |
| Near resistance | $272.25, then $280 | Breakout levels if momentum continues |
| 24h volume | 2,238,178.94 USDT | Shows active futures participation |
| Funding rate | -0.009591% | Funding can affect short-term futures costs |
Why Is SOXL Price Moving Today?
SOXL is tied to bullish semiconductor exposure, so its price can react strongly when traders rotate into chip, AI infrastructure, and high-beta technology themes. The 3X structure increases sensitivity, meaning a positive move in semiconductor sentiment can create an amplified move in SOXL-related markets.
Today’s rally also reflects short-term technical strength. SOXL has bounced from the lower end of the recent range and pushed toward the $272.25 resistance area. That is constructive, but the rally still needs follow-through. A fast move without consolidation can leave the market vulnerable to a pullback.
SOXL Price Forecast: Can Bulls Reclaim $272?
The bullish case is simple: SOXL needs to hold above $250 and then retest $272.25 with stronger buying volume. A clean move above $272.25 could open room toward $280, and a stronger breakout could bring the psychological $300 area into discussion for aggressive traders.
That does not mean $300 is the base case. SOXL futures are volatile, and leveraged ETF exposure can reverse quickly when semiconductor momentum cools. For now, $272.25 is the level that separates a normal rebound from a stronger breakout attempt.
What Happens If SOXL Loses $250 Support?
If SOXL falls back below $250, the rally starts to look weaker. In that scenario, traders may watch the $236.46 to $240 area as the next support zone. A break below that range would suggest the rebound has failed and could bring a deeper correction.
The risk is larger because this is a leveraged product traded through futures. A small move in the underlying semiconductor market can create a larger move in SOXL, and futures positions can face margin pressure if leverage is too high.
SOXL Futures Data: Mark Price, Funding, and Volume
For SOXLUSDT futures, traders should watch more than the last price. Mark price matters because it is used in liquidation calculations, while funding affects the cost of holding positions over time. The current funding rate is negative, which means traders should still review the live funding schedule before entering or holding a position.
Volume is also important. The visible 24-hour volume above 2.23 million USDT suggests active trading interest, but liquidity can change quickly around major U.S. market sessions, chip-sector headlines, and broader risk-off moves.
SOXL Technical Analysis: Momentum and Volatility
Momentum currently leans bullish after the 6.86% daily gain, but the chart is not risk-free. The $250 level is the first area to defend. If SOXL stays above it, buyers have a reasonable chance to challenge the 24-hour high again.
If price stalls below $272.25, however, the market may form a lower high or a short-term rejection. Traders should avoid reading one green move as a guaranteed trend shift, especially in a leveraged semiconductor product.
SOXL Trading Scenarios: Breakout or Pullback?
In the breakout scenario, SOXL holds $250, pushes above $272.25, and attracts enough volume to target $280 next. That would keep the short-term bias bullish and make the rally look more durable.
In the pullback scenario, SOXL loses $250 and returns toward $236.46 to $240. If buyers do not defend that zone, the setup turns bearish in the short term. Between those levels, the market may remain range-bound as traders wait for confirmation.
What This Means for SOXL Traders
SOXL is more suitable for active traders than passive investors because it combines leveraged ETF exposure with futures-specific risks. Position sizing, stop placement, funding costs, and liquidation risk matter more here than in ordinary spot trading.
Traders can also review WEEX’s TradeFi markets for other stock and ETF-linked futures products. If eligible, users interested in U.S. stock futures can check the WEEX stock futures event, which may include limited-time rewards such as first-trade protection and trading challenges.
How to Trade SOXL Futures on WEEX
- Go to the WEEX official website and create or log in to your account.
- Deposit funds, transfer crypto from another wallet, or buy supported assets through WEEX Quick Buy.
- Open the futures or TradeFi market and search for SOXLUSDT.
- Review the contract details, leverage, margin mode, mark price, funding rate, and liquidation risk before placing an order.
- Enter the order size, choose market or limit order, and manage the position with a clear stop-loss and risk limit.
Bottom Line
SOXL’s short-term bias is bullish while price holds above $250, but the rally still needs a confirmed break above $272.25 to extend. If SOXL loses $250, the market could quickly shift back toward the $236.46 to $240 support zone.
Before you go, you can learn about the WEEX Token (WXT) for ecosystem participation, and new users may explore the WEEX welcome bonus with limited-time rewards such as coupons and task-based incentives.
FAQ
1. What is SOXL?
SOXL refers to the Direxion Daily Semiconductor Bull 3X ETF, a leveraged product designed to provide amplified bullish exposure to the semiconductor sector.
2. What is the SOXL price today?
SOXLUSDT futures are trading near $258.76 in the provided WEEX market view, with a 24-hour gain of 6.86%.
3. Can SOXL break above $272?
SOXL can attempt a breakout if buyers defend $250 and volume supports a move above $272.25. Without that confirmation, the price may stay range-bound or pull back.
4. What support levels should SOXL traders watch?
The first support is around $250. If that fails, the next important zone sits near $236.46 to $240.
5. Is SOXLUSDT a spot market?
No. SOXLUSDT on WEEX is a futures market. Traders should understand leverage, margin, mark price, funding, and liquidation risk before trading.
6. Is SOXL risky to trade?
Yes. SOXL is tied to leveraged semiconductor exposure, and SOXLUSDT futures add derivatives risk. Price swings can be fast, especially during volatile technology-market sessions.
7. What is the current SOXL bias?
The short-term bias is bullish above $250, but it becomes weaker if SOXL fails to hold that level or cannot retest $272.25.
DISCLAIMER: WEEX and affiliates provide digital asset exchange services, including derivatives and margin trading, only where legal and for eligible users. All content is general information, not financial advice-seek independent advice before trading. Cryptocurrency trading is high risk and may result in total loss. By using WEEX services you accept all related risks and terms. Never invest more than you can afford to lose. See our Terms of Use and Risk Disclosure for details.
You may also like

META Stock Price Prediction 2026: Can Meta Stock Hit $1,000 in July?
META stock price prediction 2026: Can Meta hit $1,000? Analyst targets, AI cloud pivot, and how to buy META stock on WEEX explained.
USER Crypto Price Prediction 2026: Can USER Crypto Reach $1?
Is USER a good investment? Learn what is USER crypto, current price at $0.00140, and realistic USER price prediction 2026. Energy-AI narrative token analysis.
Introducing Morpho ($MORPHO): Open Credit Network and Price Prediction
Morpho is an open credit network for onchain lending, drawing attention as Morpho Midnight and ecosystem integrations expand.
MU Stock Price Prediction 2026-2030: Can Micron Hit $4,000 as AI Memory Demand Explodes?
Can MU stock reach $4,000 by 2030? Get the latest MU stock price prediction 2026-2030, analyst targets, and learn how to buy MU stock today.
$SYN Airdrop on WEEX: Complete Guide to Synapse and Claim Free $SYN
Learn Synapse tokenomics, cross-chain governance utility, and how to claim free tokens in the WEEX 50,000 USDT SYN airdrop before July 8, 2026.
MSFT Stock Analysis 2026: Why Microsoft's 33% Drop Could Be a Generational Buying Opportunity?
Top 5 TradFi Assets to Trade in 2026: Are TradFi Assets Worth Investing?
Trade Tesla, Gold, Silver, Nasdaq & Nvidia on WEEX TradFi. Compare top TradFi assets, leverage options, and how to invest in TradFi assets with USDT.
What is NVIDIA(NVDA) Coin? Everything You Need to Know About NVDA/USDT Perpetual Futures on WEEX
NVIDIA (NVDA) Coin on WEEX refers to the USDT‑margined perpetual futures tracking NVIDIA Corporation’s stock price rather than…
What is NVIDIA(NVDA) Coin? Everything You Need to Know and How to Trade NVDA/USDT on WEEX
NVDA/USDT perpetual futures were newly listed on WEEX, with trading opened on July 2, 2026. This derivative tracks…
Can NVDA Reach $250 in 2026? NVDA Price Prediction
KEY TAKEAWAYS Current price: NVDA/USDT futures trade near $196.13 at publication time. Required move: around +27.5% is needed…
NVIDIA (NVDA) Price Prediction: July 2026 Forecast, Technical Levels, and Strategy
NVIDIA (NVDA) has become the bellwether for AI risk appetite, and traders can access its crypto-settled exposure via…
Sandisk Stock Price Prediction 2026–2030: Can SNDK Reach $3,000?
Bernstein set a $3,000 price target on Sandisk stock the day before it fell 10% to start Q3. At approximately $2,023 today, getting to $3,000 means roughly 48% appreciation. This guide examines what that path requires, what the bear case says, and what the realistic range of outcomes looks like through 2030.
What Is Sandisk and Why Did It Go From $40 to $2,000 in One Year?
Sandisk stock went from approximately $40 in early 2025 to over $2,000 in 2026, a gain exceeding 4,900% in roughly eighteen months. This guide explains what Sandisk actually is, why it was ignored for years, and what changed to produce one of the most extraordinary stock price moves in recent market history.
Sandisk Stock Falls 10% to Start Q3: Is the AI Memory Rally Finally Over?
Sandisk stock dropped approximately 10% on July 1, the first trading day of Q3, after surging over 720% in the first half of 2026. The selloff had nothing to do with the company's business. This guide examines what actually triggered the decline, whether it signals the end of the AI memory rally, and what investors should actually be watching.
What is Synapse(SYN) Coin? Everything You Need to Know for Cross‑Chain Trading and Investing
Synapse (SYN) is a cross-chain interoperability protocol enabling secure asset transfers, messaging, and smart contract calls across multiple…
SK Hynix Stock Price Forecast 2026–2027: Structural HBM Shortage Analysis
Expect a clear look at how the AI-driven memory cycle and a structural HBM bottleneck could shape SK…
Can SK Hynix Reach $2000 in 2026? SK Hynix Price Prediction
KEY TAKEAWAYS Current price: $1523, based on live market data today from major crypto trackers. Required move to…
If You Can’t Buy SK Hynix Stocks, What Are the Trading Alternatives?
If your broker doesn’t support SK Hynix or you want 24/7 access, you can still trade SK Hynix…
META Stock Price Prediction 2026: Can Meta Stock Hit $1,000 in July?
META stock price prediction 2026: Can Meta hit $1,000? Analyst targets, AI cloud pivot, and how to buy META stock on WEEX explained.
USER Crypto Price Prediction 2026: Can USER Crypto Reach $1?
Is USER a good investment? Learn what is USER crypto, current price at $0.00140, and realistic USER price prediction 2026. Energy-AI narrative token analysis.
Introducing Morpho ($MORPHO): Open Credit Network and Price Prediction
Morpho is an open credit network for onchain lending, drawing attention as Morpho Midnight and ecosystem integrations expand.
MU Stock Price Prediction 2026-2030: Can Micron Hit $4,000 as AI Memory Demand Explodes?
Can MU stock reach $4,000 by 2030? Get the latest MU stock price prediction 2026-2030, analyst targets, and learn how to buy MU stock today.
$SYN Airdrop on WEEX: Complete Guide to Synapse and Claim Free $SYN
Learn Synapse tokenomics, cross-chain governance utility, and how to claim free tokens in the WEEX 50,000 USDT SYN airdrop before July 8, 2026.