
Shiba Inu (SHIB) Price Prediction 2027: What Would It Take to Reach $0.00001?

 Prefer us on Google
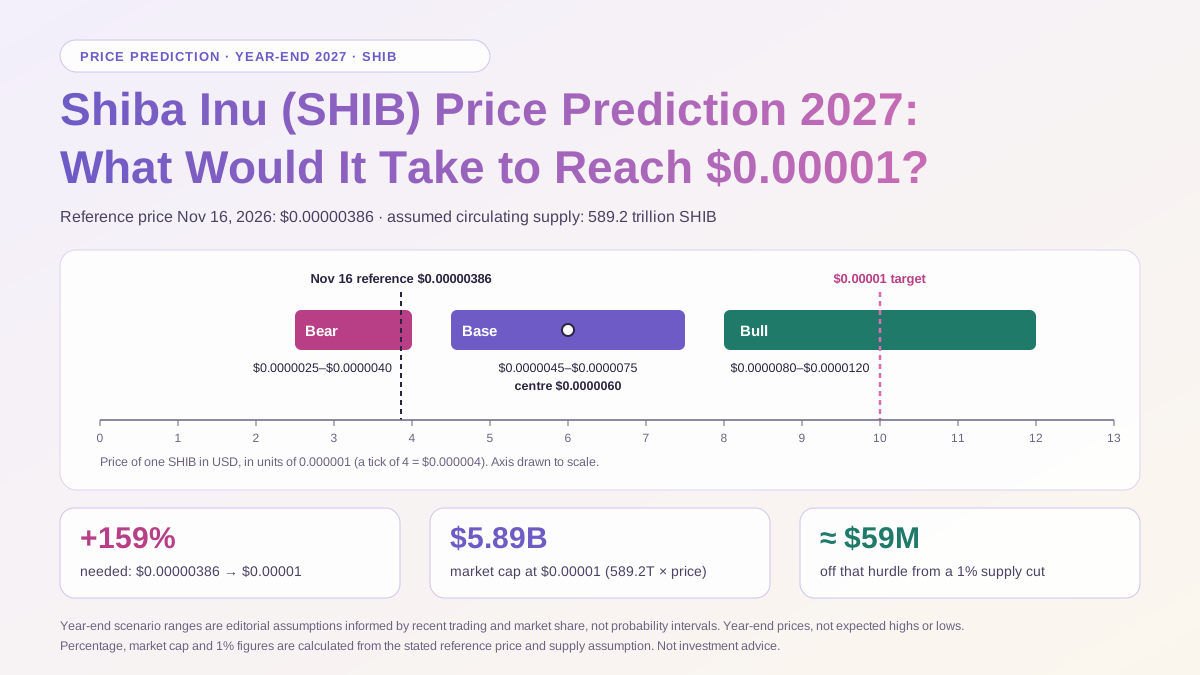
Shiba Inu (SHIB) could reach $0.00001 in 2027, but that is a bull-case outcome, not our base forecast. Our year-end 2027 base range is $0.0000045–$0.0000075, with a central estimate of $0.0000060. From the November 16, 2026 reference price of $0.00000386, reaching $0.00001 would require a gain of roughly 159%. At an assumed circulating supply of 589.2 trillion SHIB, that target implies a market capitalization of about $5.89 billion.
The most plausible path to $0.00001 is a recovery in demand for SHIB relative to other crypto assets. Burns can lower the market cap required to reach a given price, but the reduction has to be large compared with the circulating supply. Even a hypothetical 1% supply reduction would lower the market-cap hurdle for $0.00001 by only about $59 million. For this forecast, sustained spot demand matters much more than a dramatic burn-rate headline.
On WEEX, the 1000SHIB/USDT perpetual futures page uses a quote based on 1,000 SHIB, while the SHIB/USDT spot market quotes SHIB directly. The forecasts below refer to one SHIB in U.S. dollars, so normalize the futures quote before comparing it with the price targets.
Key Takeaways
- 2027 base case: $0.0000045–$0.0000075 at year-end, with a central estimate of $0.0000060.
- 2027 bull case: $0.0000080–$0.0000120 at year-end. A move to $0.00001 fits this case and would imply a market cap of about $5.89 billion at the baseline supply.
- A 1% supply cut barely changes the hurdle: the market cap required for $0.00001 would fall from $5.89 billion to $5.83 billion.
- The best confirmation would come from spot trading: a sustained recovery above the recent trading range, stronger spot volume and improving relative performance would carry more weight than a brief futures-led rally.
Shiba Inu (SHIB) Price Prediction for 2026, 2027 and 2030
The table gives year-end scenario ranges, not expected trading highs and lows for the whole year. SHIB could touch a target during a rally and then finish the year below it. We use one supply assumption across the main forecasts so that changes in the ranges reflect differences in demand. A separate table below shows what happens if circulating supply falls.
| Year-end | Bear case | Base case | Bull case | Base-case implied market cap |
|---|---|---|---|---|
| 2026 | $0.0000027–$0.0000034 | $0.0000034–$0.0000048 | $0.0000048–$0.0000062 | $2.00B–$2.83B |
| 2027 | $0.0000025–$0.0000040 | $0.0000045–$0.0000075 | $0.0000080–$0.0000120 | $2.65B–$4.42B |
| 2030 | $0.0000015–$0.0000040 | $0.0000050–$0.0000120 | $0.0000150–$0.0000300 | $2.95B–$7.07B |
The model uses the formula implied SHIB price = scenario market capitalization ÷ assumed circulating SHIB. The market-cap bands are editorial assumptions informed by the current reference price, recent trading history and the amount of market share SHIB would need in different environments. They are not probability intervals. The gaps between some bands reflect the distinction between scenarios; they do not rule out intermediate prices.
The main inputs are CoinGecko’s historical SHIB price data and a rounded circulating-supply estimate of 589.2 trillion SHIB, consistent with both a November market-data snapshot and the figure cited in a Cryptex registration filing. Multiplying the $0.00000386 reference price by the assumed supply gives a consistent starting valuation of about $2.27 billion. This is a calculated benchmark. A provider’s displayed market-cap snapshot can differ if it uses a different timestamp or supply estimate.
Shiba Inu (SHIB) Price Prediction for the Rest of 2026
The $0.0000034–$0.0000048 base range assumes SHIB spends the remainder of 2026 near its November trading range. CoinGecko’s historical table recorded $0.00000462 on November 3, $0.00000383 on November 14 and $0.00000386 on November 16. The November 3 to November 16 move was a decline of about 16%. A rebound from a recent low would be a start, but the first useful sign of a broader recovery would be reclaiming the $0.0000046–$0.0000048 area and holding it through more than one brief rally.
A sustained move below roughly $0.0000038 would make a test of the lower part of the year-end range more plausible. The bear case becomes more relevant if lower prices coincide with poor spot liquidity and continued losses relative to the broader market. In the other direction, a durable recovery above $0.0000050–$0.0000052, with stronger spot activity on both rallies and pullbacks, would make the $0.0000048–$0.0000062 year-end upside scenario more credible.
These levels are approximate reference zones based on recent trading, not guaranteed support or resistance. A low-liquidity wick can pass through a level without establishing a new trend. Whether buyers return on the next pullback matters more than the first print above a line.
Shiba Inu (SHIB) Price Prediction for 2027: What Drives Each Scenario?
The 2027 outlook depends on two variables: the size of the overall crypto market and the share of that market investors assign to SHIB. A broader recovery can lift the token even if its relative standing is unchanged. A sustained move to $0.00001 is easier to defend if both the wider market and SHIB’s share of it improve.
Bear case: $0.0000025–$0.0000040
At the baseline supply, this range implies a market cap of about $1.47 billion to $2.36 billion. It covers an environment in which investors remain cautious or shift their meme-token exposure elsewhere. SHIB could also lag a recovering market if the token fails to attract sustained spot demand. A new product launch, a brief spike in social activity or higher blockchain transaction counts would not change this scenario by themselves.
One warning sign would be a repeating pattern: price rallies on rising futures activity, but spot turnover fails to follow and the gains reverse once leveraged positions unwind. In that environment, volatility can stay high even as the year-end price remains close to, or below, the November 2026 reference.
Base case: $0.0000045–$0.0000075
The base range implies $2.65 billion to $4.42 billion in market cap. The midpoint, $0.0000060, corresponds to about $3.54 billion and is roughly 55% above the November 16 reference price. The starting price matters here: a large percentage rebound from a depressed level still leaves SHIB well below its historical peak. The base case assumes that risk appetite and spot demand recover enough to lift the token, without requiring it to become the leading meme trade of the year.
The top of the range requires more than a brief return to early-November levels. A move above $0.0000050 that holds on a pullback would be a preliminary test. A sustained move through $0.0000075, with stronger relative performance and spot liquidity, would support revisiting the base case from above.
Bull case: $0.0000080–$0.0000120
The bull range implies a market cap of $4.71 billion to $7.07 billion. It assumes a favorable broader crypto market and a period in which SHIB attracts a greater share of demand. Shibarium adoption or successful ecosystem initiatives could reinforce the move if they lead to measurable SHIB buying or meaningful net supply reduction. They are not required for a speculative rally, and their announcements alone would not justify this range.
SHIB has traded above $0.00001 before. CoinLore’s annual market history shows a 2024 high well above that level. That history establishes that $0.00001 is not unprecedented; it does not make a return to that price the most likely outcome. The relevant evidence is whether demand can sustain the valuation under today’s supply and market conditions.
Can Shiba Inu (SHIB) Reach $0.00001? The Market-Cap Test
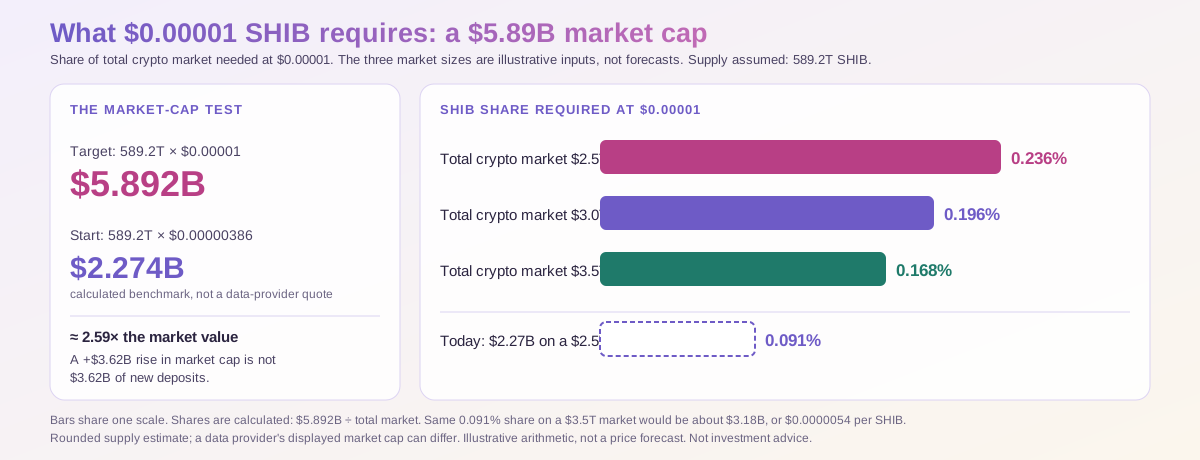
At 589.2 trillion circulating SHIB, the price target of $0.00001 implies $5.892 billion in market capitalization. Relative to the $2.27 billion starting valuation calculated from the November 16 price, that is about 2.59 times as much market value. Market cap is the price of the marginal trade multiplied by circulating tokens. A roughly $3.62 billion rise in market cap does not mean investors must deposit $3.62 billion of new money.
One way to assess the target is to ask what share of the entire crypto market SHIB would need at different market sizes. These are illustrative inputs, not forecasts for the global crypto market.
| Hypothetical total crypto market cap | SHIB’s required share at $0.00001 | Interpretation |
|---|---|---|
| $2.5 trillion | 0.236% | The target would rely more heavily on SHIB outperforming the broader market. |
| $3.0 trillion | 0.196% | A broader recovery helps, but SHIB still needs a meaningful share of investor demand. |
| $3.5 trillion | 0.168% | A larger overall market lowers the relative share needed for the same SHIB price. |
For comparison, the calculated $2.27 billion starting valuation would represent about 0.091% of an illustrative $2.5 trillion market. If the overall market rose to $3.5 trillion but SHIB kept that same share, SHIB’s implied market cap would be roughly $3.18 billion, or $0.0000054 per token. This example shows why a broad rally could support the base case while falling short of $0.00001. In that scenario, SHIB has to gain market share too.
Spot-market behavior can help distinguish those outcomes. A move toward $0.00001 is more persuasive if SHIB rises relative to Bitcoin and other comparable assets over multiple weeks, spot volume improves across venues, and the token holds gains when futures funding cools. One green session can move the price; sustained participation is what makes a higher year-end range more credible.
How Much Can Token Burns Change the Shiba Inu (SHIB) Forecast?
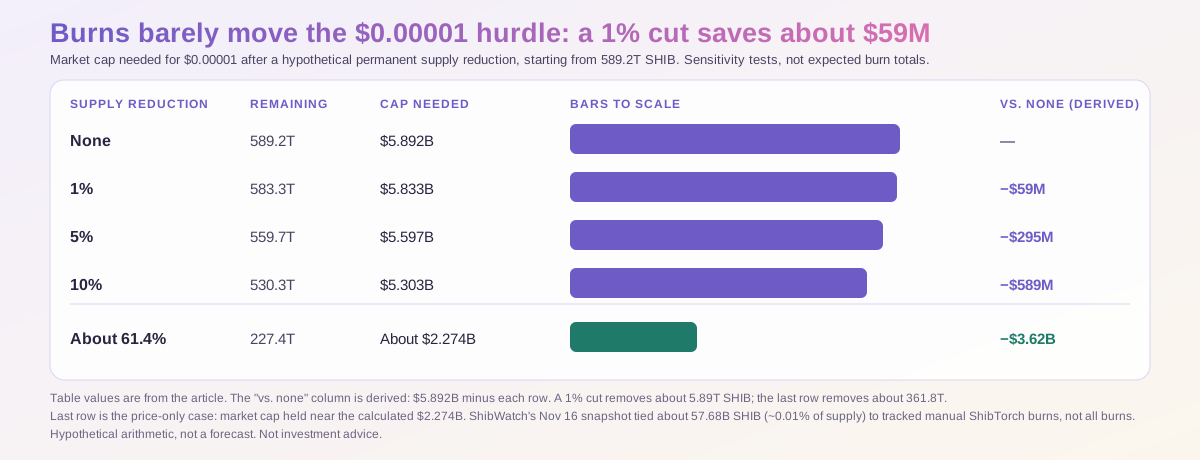
A burn permanently removes tokens from spendable supply when executed through an appropriate mechanism. The price impact depends on how many tokens leave circulation and how demand changes. Under a constant-market-cap assumption, a 1% cut in circulating supply raises the implied price by only about 1.01%. In actual trading, market cap can rise or fall at the same time, so even that mechanical effect is not a guarantee.
The table isolates supply. Each row starts from 589.2 trillion SHIB and asks what market cap would be required for the same $0.00001 price after a hypothetical permanent reduction. The reductions are sensitivity tests, not expected burn totals.
| Hypothetical circulating-supply reduction | Remaining circulating SHIB | Market cap needed for $0.00001 |
|---|---|---|
| None | 589.2T | $5.892B |
| 1% | 583.3T | $5.833B |
| 5% | 559.7T | $5.597B |
| 10% | 530.3T | $5.303B |
| About 61.4% | 227.4T | About $2.274B |
The last row holds market cap near the calculated November 16 benchmark. If demand did not lift the market value at all, approximately 361.8 trillion SHIB would have to leave circulation for price alone to reach $0.00001 under this model. The scale is the point. Even the 1% row would require the removal of about 5.89 trillion SHIB.
To compare that hurdle with observed activity, ShibWatch’s November 16 tracker snapshot attributed about 57.68 billion SHIB to a specific set of manual ShibTorch burns. That is around 0.01% of the assumed circulating supply. It is a cumulative reading for a tracked route, not a measure of all SHIB burns or a pace that can be extrapolated. An analyst should confirm the unit, the time period, the transaction and whether the burn actually reduces net circulating supply before using it in a model.
What Shibarium usage tells us about demand for SHIB
Shibarium’s documentation identifies BONE as the network currency. The Shib Daily’s explanation of ShibTorch describes how part of accumulated base fees can be converted from BONE to SHIB for burning. A rise in Shibarium transactions can help that process, but transaction count itself does not reveal the amount of fees collected, the amount of SHIB actually burned, or whether new users are buying and holding SHIB.
For the forecast, the stronger evidence would be a sustained increase in fees, verified burns measured in absolute SHIB units, and observable demand for SHIB itself. Those figures answer different questions: how much users pay to use the network, how much supply is removed, and whether the token is attracting buyers. The base case does not assume that the three will rise together.
Shiba Inu (SHIB) Price Prediction for 2030
Our $0.0000050–$0.0000120 base range for year-end 2030 corresponds to about $2.95 billion to $7.07 billion at the baseline supply. It assumes SHIB remains widely traded and retains a recognizable share of the meme-token market. The longer horizon allows more time for stronger demand or verified supply changes, but it also gives competitors more time to take attention and liquidity away.
The $0.0000150–$0.0000300 bull range implies approximately $8.84 billion to $17.68 billion. Sustaining those levels would require either a much larger crypto market or stronger and more durable demand for SHIB relative to the rest of the market. The $0.0000015–$0.0000040 bear range reflects the opposite possibility: the token remains technically available, but persistent competition and falling liquidity make it harder to sustain a premium.
For scale, $0.0001 would imply roughly $58.92 billion at today’s modeled supply, and $0.01 would imply about $5.89 trillion. Those prices cannot be evaluated simply by counting zeros. Compare the market caps and supply assumptions behind them before treating them as plausible long-term targets.
How to Trade Shiba Inu (SHIB) on WEEX
For Futures, select 1000SHIB/USDT and check the live order book, margin settings, funding rate and liquidation price before submitting a long or short order. For a rough unit conversion, multiply the single-token target by 1,000: $0.00001 per SHIB corresponds to about 0.01000 USDT per 1,000 SHIB if USDT is near $1 and the futures quote tracks the underlying price. The live contract can trade at a premium or discount. Funding, fees and liquidation risk also mean that a correct long-term price forecast can still produce a losing futures trade.
For Spot, select SHIB/USDT, check the pair label and the order preview, then choose the amount and order type. A limit order lets you specify the maximum price you are willing to pay, though it may not fill. An unleveraged spot purchase does not face futures liquidation, but it remains exposed to price losses. The forecast in this article uses the single-token spot price in U.S. dollars, regardless of which product a reader uses.
WEEX Editorial View
$0.00001 belongs in the 2027 upside case. The arithmetic shows how SHIB can get there, and its trading history shows that this price is possible. The evidence available today is stronger for a partial recovery toward $0.0000060 than for a sustained return to a valuation near $5.9 billion. Burning tokens can help at the margin. It is not a substitute for market demand at the scale this particular target requires.
The clearest reason to raise the forecast would be a combination of three developments: SHIB holds above its recent range, gains market share as the broader market recovers, and continues to attract spot buyers after leveraged positioning cools. Conversely, if rallies repeatedly fade and SHIB loses market share even in a stronger market, the $0.0000045–$0.0000075 base range deserves a downward revision. Those are better tests than whether the token briefly touches a round number.
FAQ
1. What Is the Shiba Inu (SHIB) Price Prediction for 2027?
The year-end 2027 base case is $0.0000045–$0.0000075, with a central estimate of $0.0000060. The bear range is $0.0000025–$0.0000040, and the bull range is $0.0000080–$0.0000120.
2. Can Shiba Inu (SHIB) Reach $0.00001 in 2027?
Yes, in the bull case. It would require roughly a 159% gain from the $0.00000386 reference price, and about $5.89 billion in market capitalization at 589.2 trillion circulating tokens. A temporary touch is easier to achieve than a sustained year-end price at that level.
3. How Much Shiba Inu (SHIB) Would Need to Burn to Reach $0.00001?
If the calculated starting market cap stayed near $2.27 billion, circulating supply would have to fall to roughly 227 trillion SHIB, a reduction of about 61.4%. If market cap rises, the required burn falls. There is no fixed burn amount that can guarantee the target.
4. What Is the Shiba Inu (SHIB) Price Prediction for 2030?
Our year-end 2030 base range is $0.0000050–$0.0000120. The upper end assumes SHIB retains meaningful market demand over several years. The forecast becomes less useful if liquidity or circulating supply changes materially.
5. Does a Rise in Shibarium Transactions Automatically Raise the Price of Shiba Inu (SHIB)?
No. Shibarium uses BONE as its network currency. Higher activity can support fee generation and the mechanism that converts some fees into SHIB burns. Whether the SHIB price benefits depends on actual buying demand, liquidity and the scale of supply reduction.
This content is provided for general informational purposes only and doesn't constitute financial, investment, legal, or tax advice. Any events, rewards, online promotions, or related information mentioned herein should not be considered a recommendation, solicitation, or invitation to purchase, sell, trade, or otherwise deal in any crypto assets. Crypto assets are highly volatile and may result in loss. The availability of WEEX services, products, and related events may vary by region. You are responsible for ensuring that your participation is in accordance with applicable local laws and regulations.
You may also like
Mercado Bitcoin Withdrawal Update: Pix Restart and Crypto Suspension
Mercado Bitcoin set November 17 for Pix deposits and withdrawals in Brazilian reais. Read the withdrawal rules and the background to the crypto suspension.
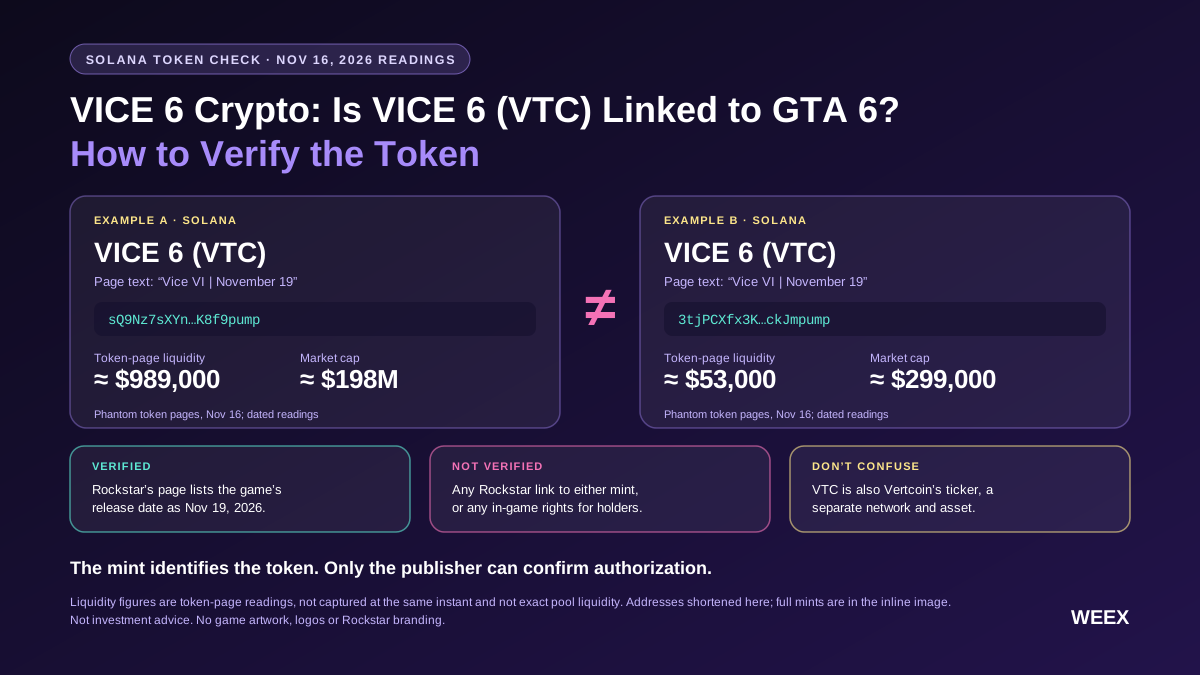
VICE 6 Crypto: Is VICE 6 (VTC) Linked to GTA 6? How to Verify the Token
Is VICE 6 crypto linked to GTA 6? Compare two Solana tokens using VTC, verify their mint and pool addresses, and see what Rockstar has confirmed.
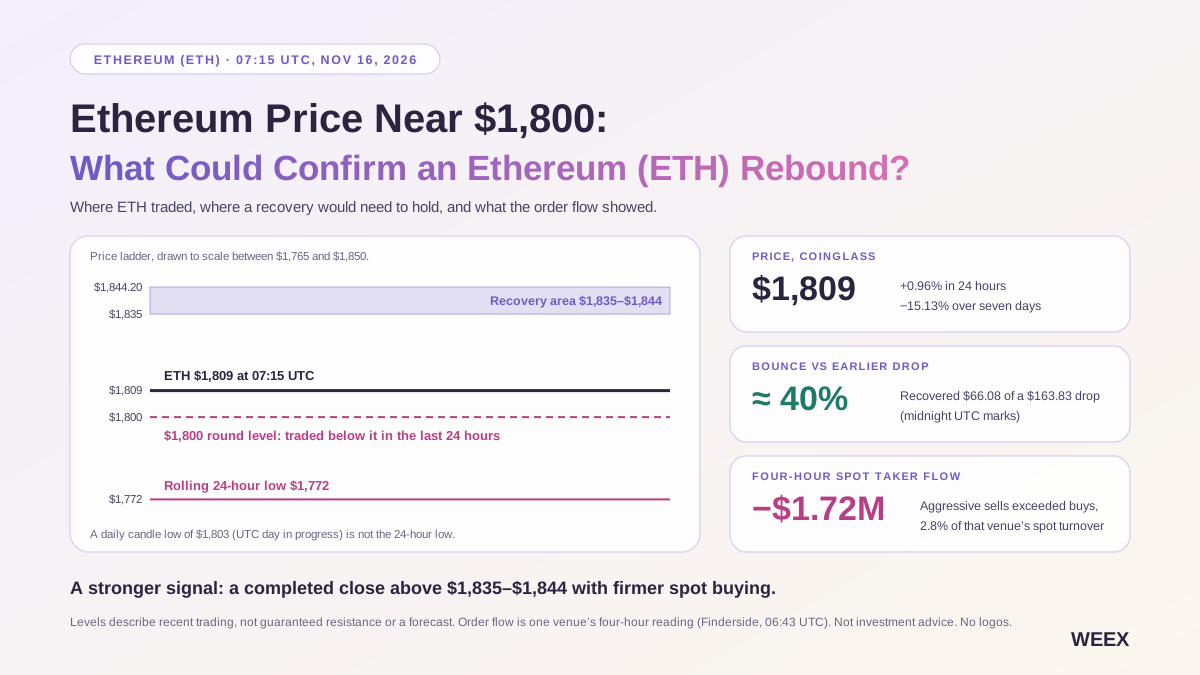
Ethereum Price Near $1,800: What Could Confirm an Ethereum (ETH) Rebound?
Ethereum traded near $1,800 on November 16. See what four-hour spot order flow, futures positioning, and Friday’s ETF flows say about an ETH rebound.
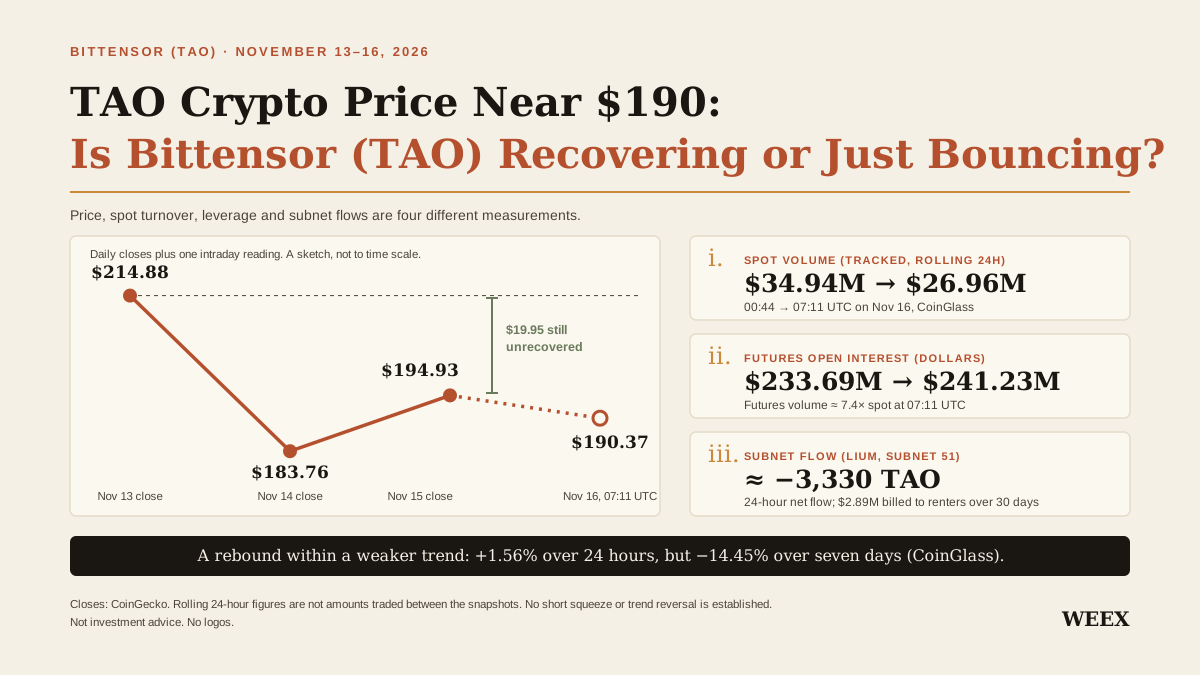
TAO Crypto Price Near $190: Is Bittensor (TAO) Recovering or Just Bouncing?
TAO bounced near $190. Compare spot volume, futures positioning, and Bittensor subnet flows to see what would confirm a more durable recovery.
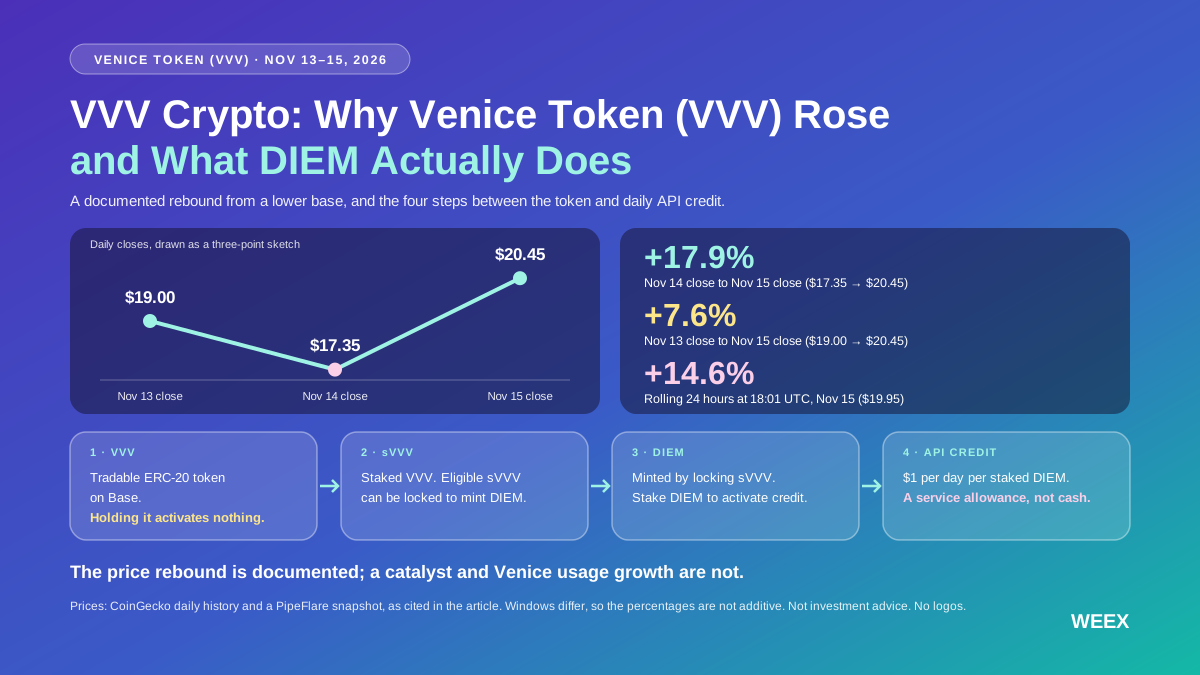
VVV Crypto: What Is Venice Token, Why Venice Token (VVV) Rose and What DIEM Actually Does
Venice Token rose about 14.6% in one November 15 snapshot. Learn what the data shows, how VVV staking works, and what DIEM’s daily API credit buys.
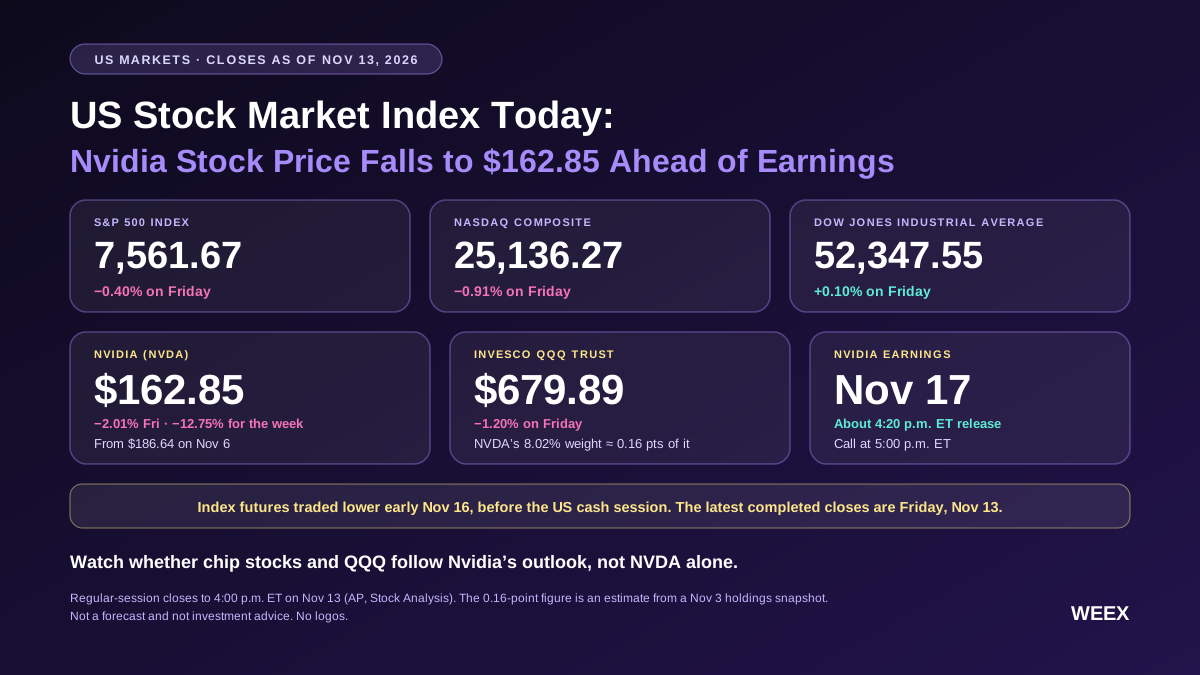
US Stock Market Index Today: Nvidia Stock Price Falls to $162.85 Ahead of Earnings(S&P 500 and QQQ )
Track US stock index futures, the S&P 500 and Dow, and see how Nvidia’s $162.85 close and November 17 earnings could shape QQQ and the broader market.
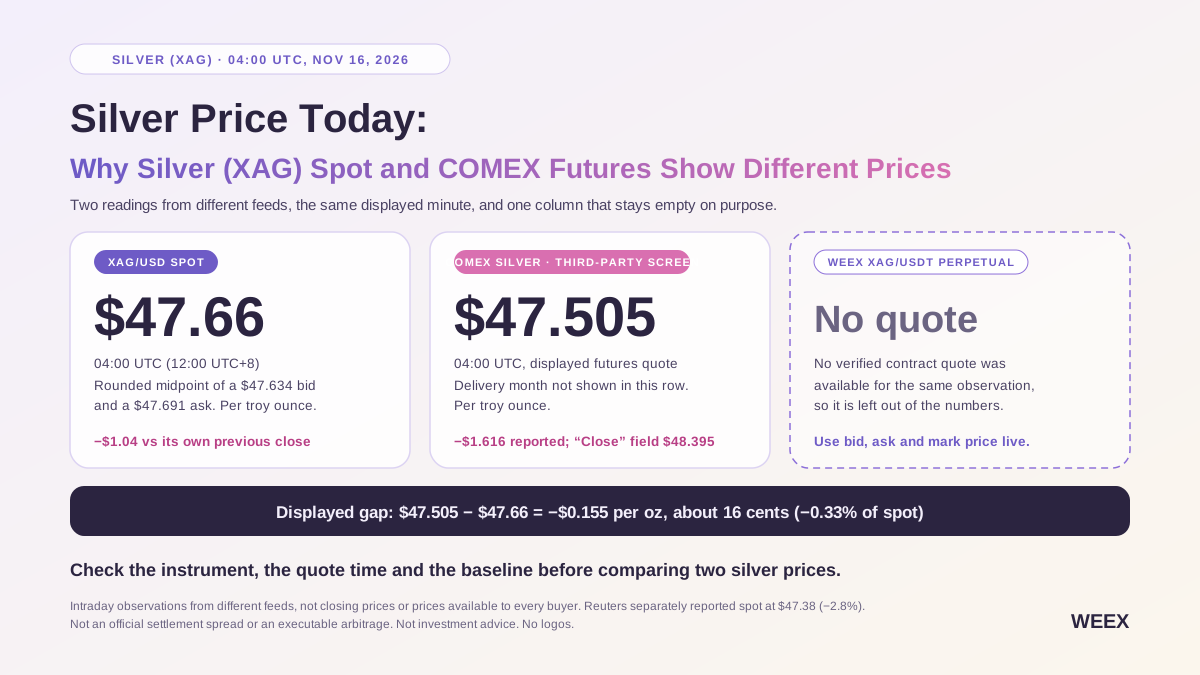
Silver Price Today: Why Silver (XAG) Spot and COMEX Futures Show Different Prices
Silver traded near $47–$48 on November 16. Compare XAG/USD spot, COMEX silver futures, and XAG/USDT perpetuals, and learn why their prices differ.
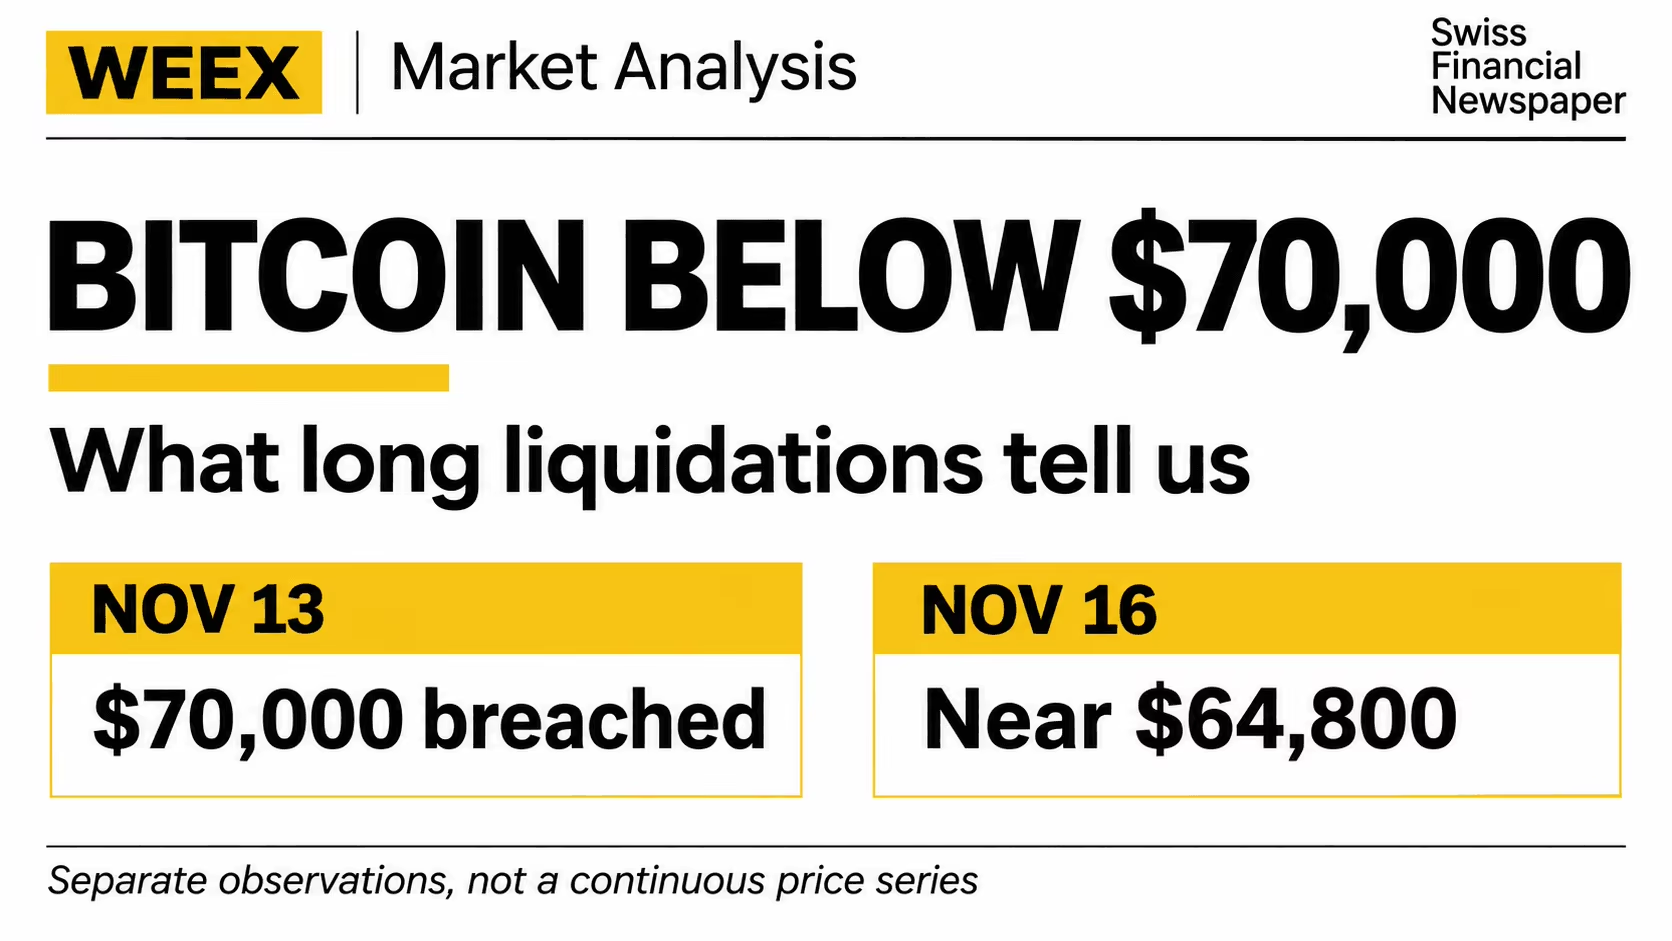
Why Did Bitcoin (BTC) Drop Below $70,000? What Long Liquidations Tell Us
See why Bitcoin fell below $70,000 on November 13, how long liquidations amplified the decline, and what to watch before calling a rebound. If you already plan to trade, you can check whether your activity qualifies for the WEEX Lucky Eggs event, scheduled to run through November 25, 2026 (UTC+8).
Binance Hack Exposes Cybersecurity Gaps at Crypto Exchanges
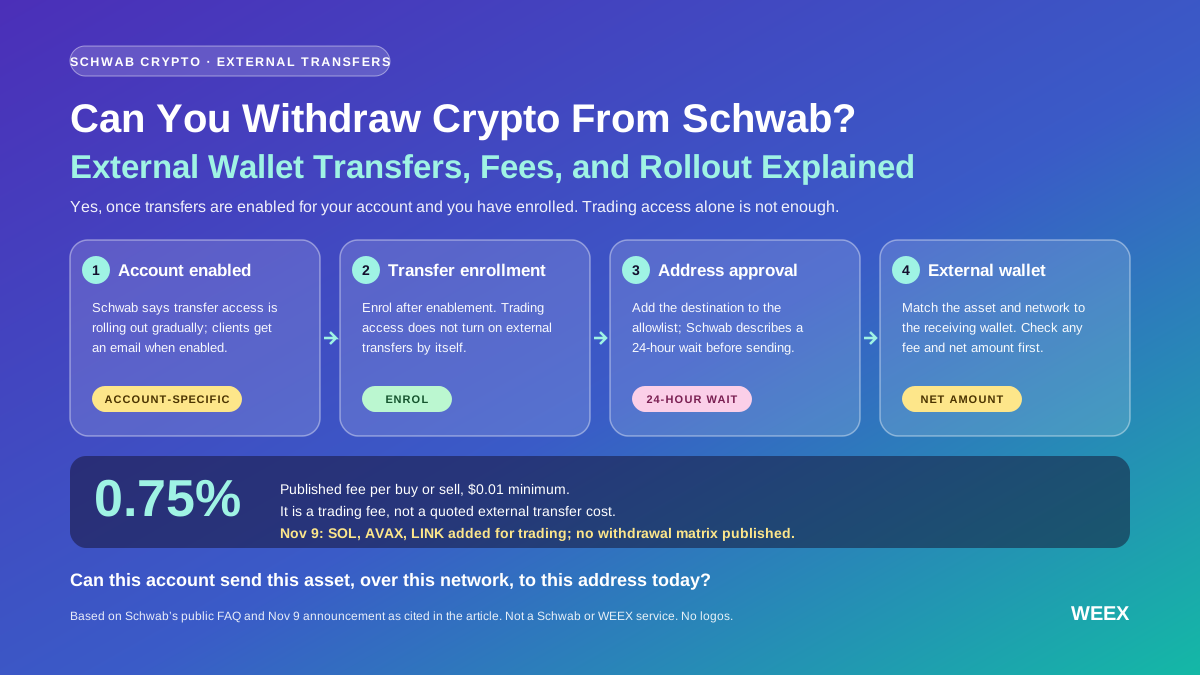
Can You Withdraw Crypto From Schwab? External Wallet Transfers, Fees, and Rollout Explained
Find out when Schwab Crypto allows external wallet withdrawals, how the 24-hour address wait works, and why the 0.75% trading fee is separate.
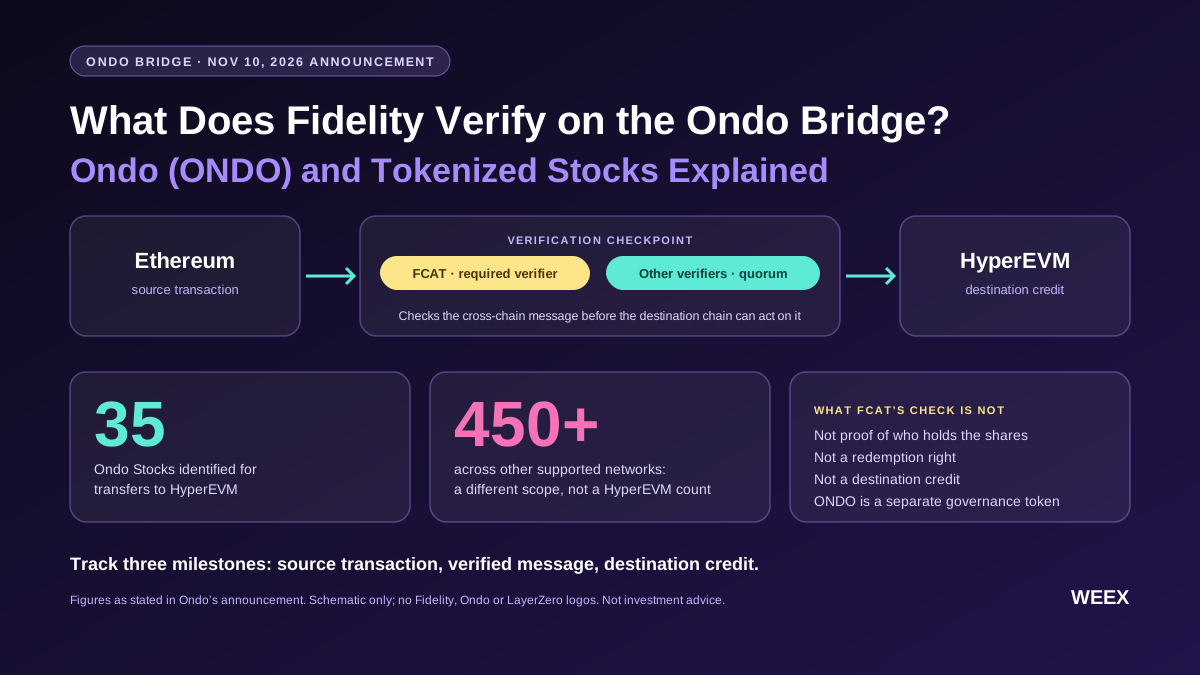
What Does Fidelity Verify on the Ondo Bridge? Ondo (ONDO) and Tokenized Stocks Explained
Learn what Fidelity’s FCAT verifies on the Ondo Bridge, how to check a tokenized stock transfer, and why Ondo Stocks differ from the ONDO token.
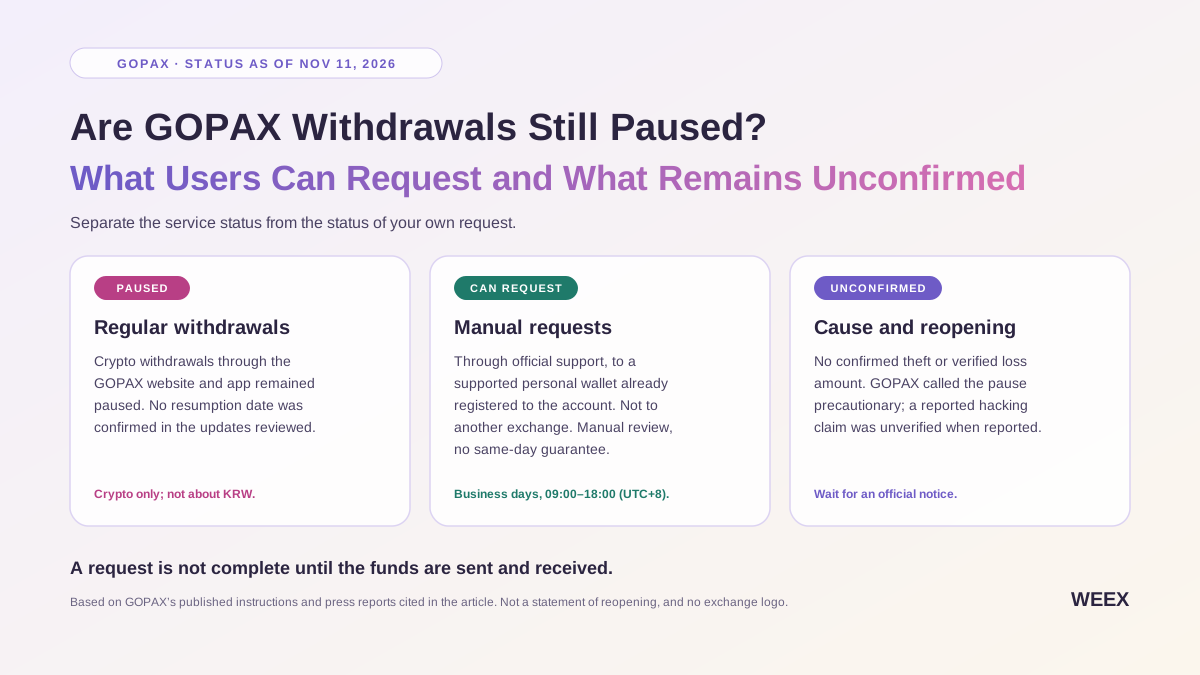
Are GOPAX Withdrawals Still Paused? What Users Can Request and What Remains Unconfirmed
Check the latest GOPAX withdrawal status, which wallets qualify for manual requests, and how to tell whether your crypto withdrawal has been sent.
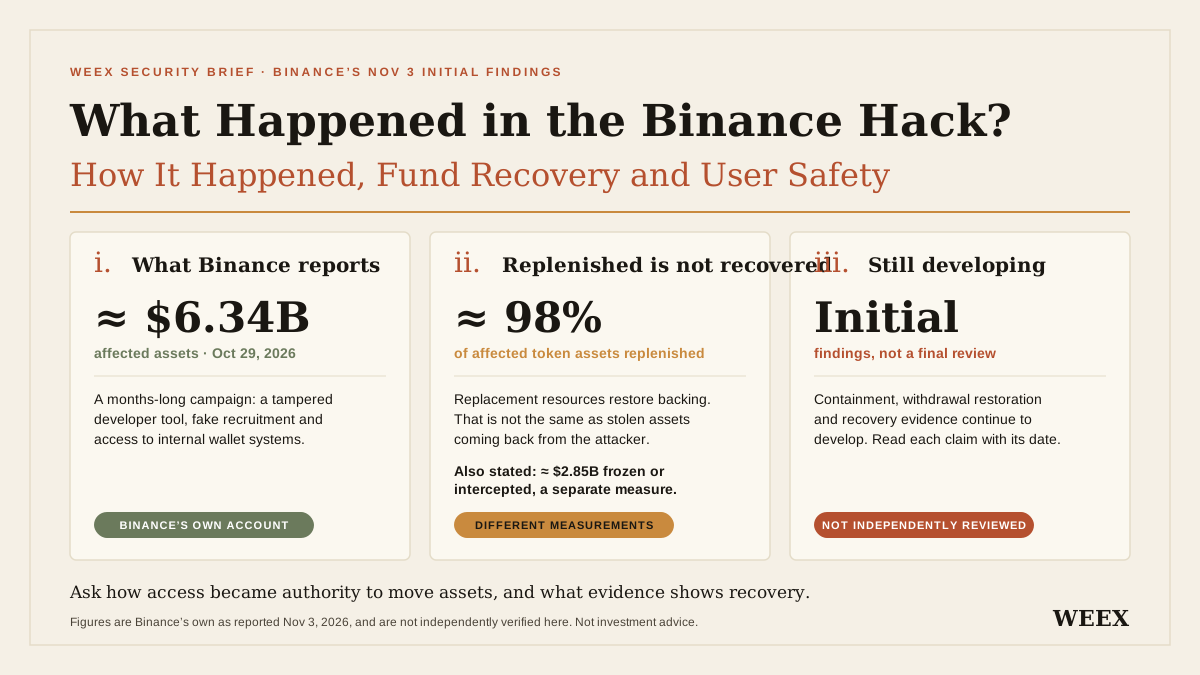
What Happened in the Binance Hack? How It Happened, Fund Recovery and User Safety
What happened in the Binance hack? Review the attack timeline, latest fund replenishment, recovery limits and practical steps to protect your account.
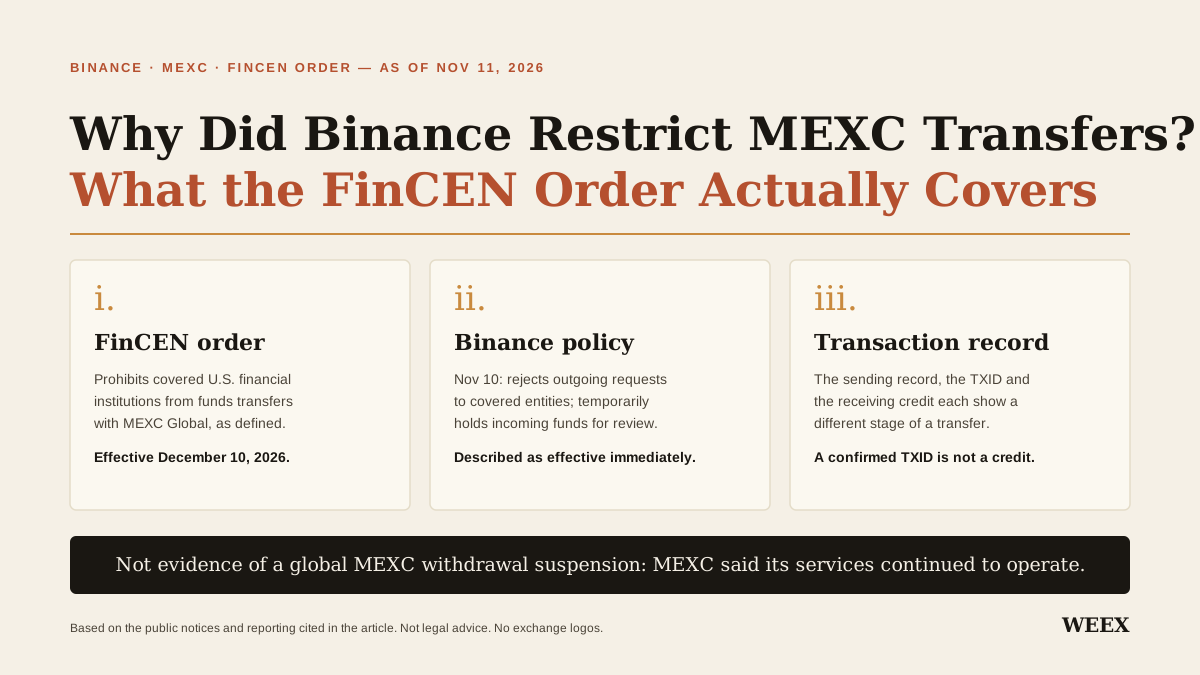
Why Did Binance Restrict MEXC Transfers? What the FinCEN Order Actually Covers
Find out why Binance restricted MEXC transfers, when the FinCEN order takes effect, and what to check if your crypto deposit is held for review.

What Is Elysium Crypto? The Hyperliquid Layer 2, Gas Fees, and Token Confusion Explained
Learn what Elysium is, why it uses HYPE for gas, how KNTQ buybacks are designed, and how to distinguish bridge TVL from actual DeFi activity.
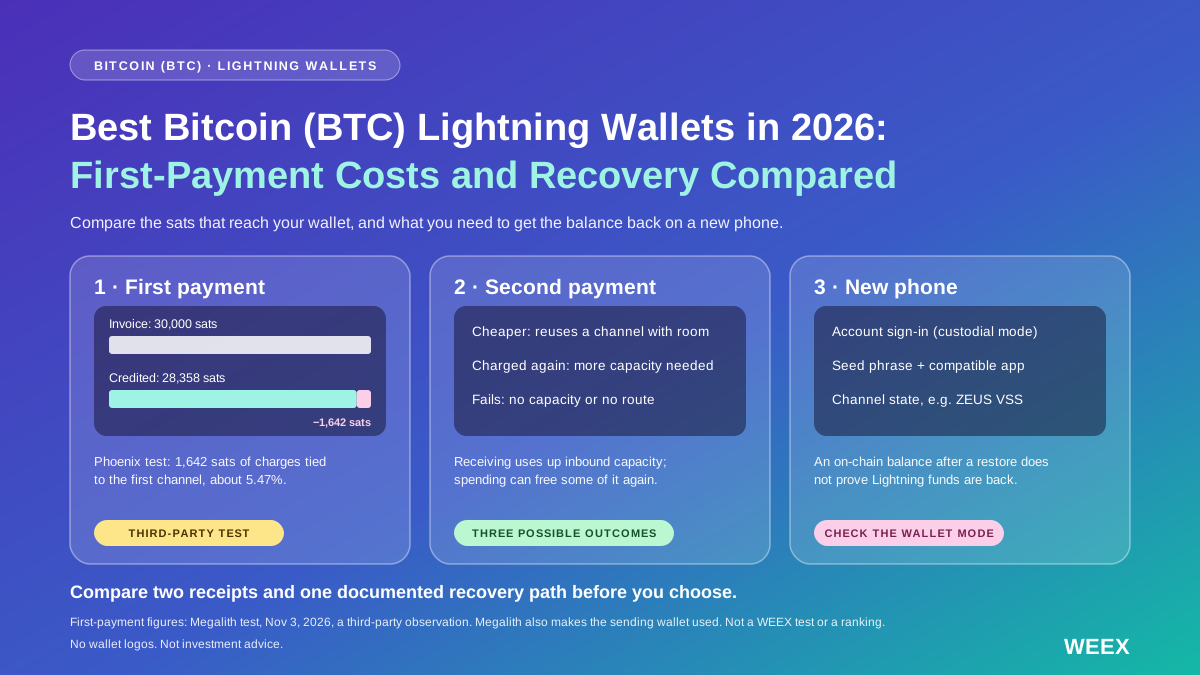
Best Bitcoin (BTC) Lightning Wallets in 2026: First-Payment Costs and Recovery Compared
Key Takeaways Lightning Network wallets enable fast and cost-effective Bitcoin transactions by using off-chain channels. A variety of…
Crypto ATM Fees: How Much Bitcoin (BTC) Do You Get for $100?
See how much Bitcoin $100 buys at a crypto ATM. Compare two sample quotes, calculate the all-in cost, and learn which fees not to count twice.
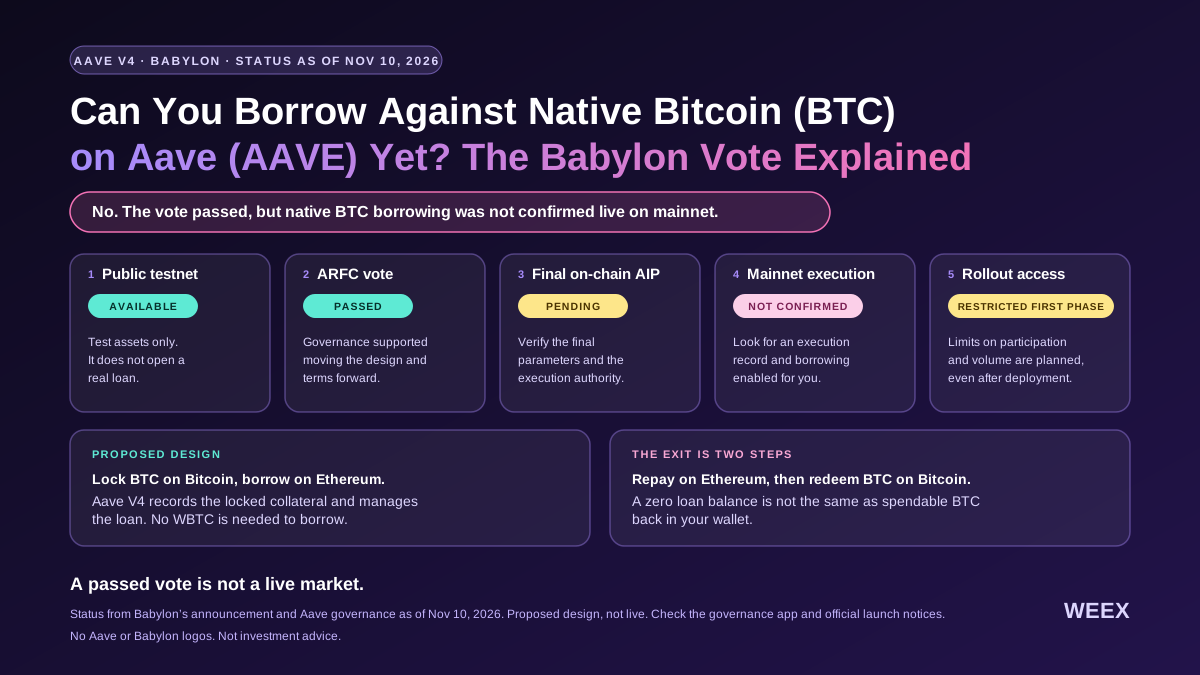
Can You Borrow Against Native Bitcoin (BTC) on Aave (AAVE) Yet? The Babylon Vote Explained
Can you borrow against native Bitcoin on Aave yet? See what the Babylon vote approved, what still needs to launch, and how BTC liquidation would work.
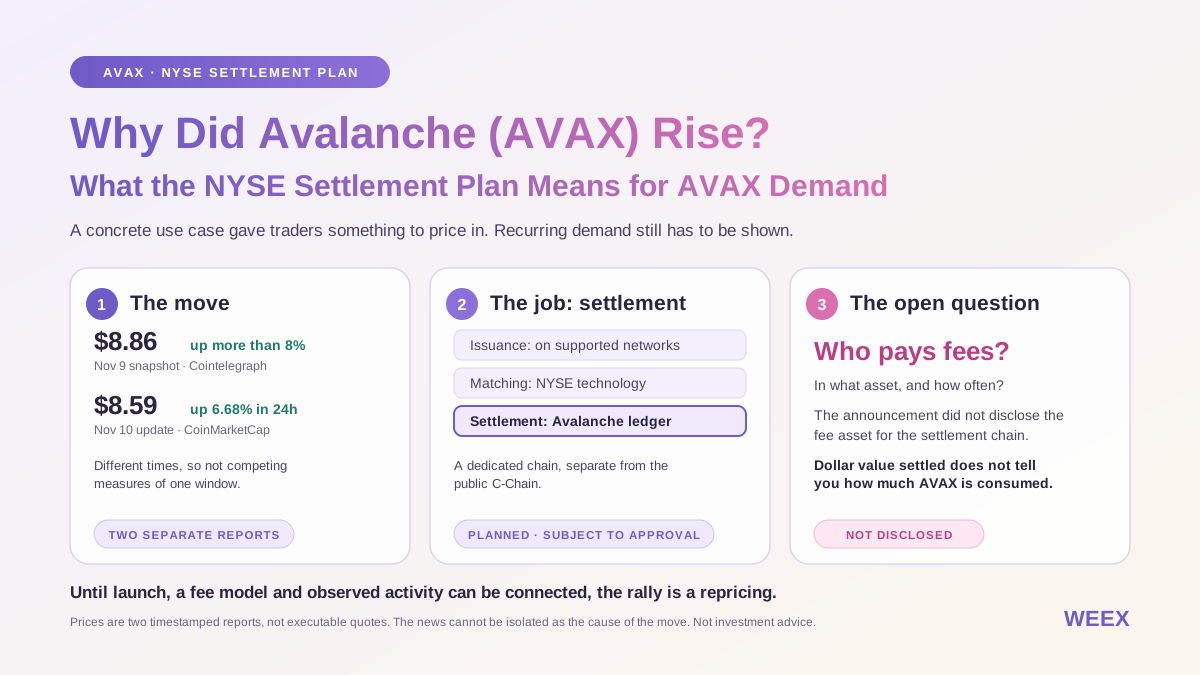
Why Did Avalanche (AVAX) Rise? What the NYSE Settlement Plan Means for AVAX Demand
See why Avalanche (AVAX) rallied after the NYSE settlement announcement, how the dedicated chain would work, and what could create demand for AVAX.
Zcash (ZEC) Price Up 7% in 24 Hours: Trading Volume, Market Context and What to Verify
ZEC rose roughly 5% to 7% to about $1,295 to $1,320 on November 5, 2026, on about $1.2 billion in 24-hour volume, but no source confirms why. The NU7 upgrade, which cuts block time from 75 to 25 seconds, is due around November 5 to 6 and is unconfirmed.
Will NYSE Tokenized Stocks Have Voting Rights? What the Broadridge Plan Means for Investors
Will NYSE tokenized stocks have voting rights? Understand Broadridge’s plan, shareholder eligibility, record dates and how stock futures differ.
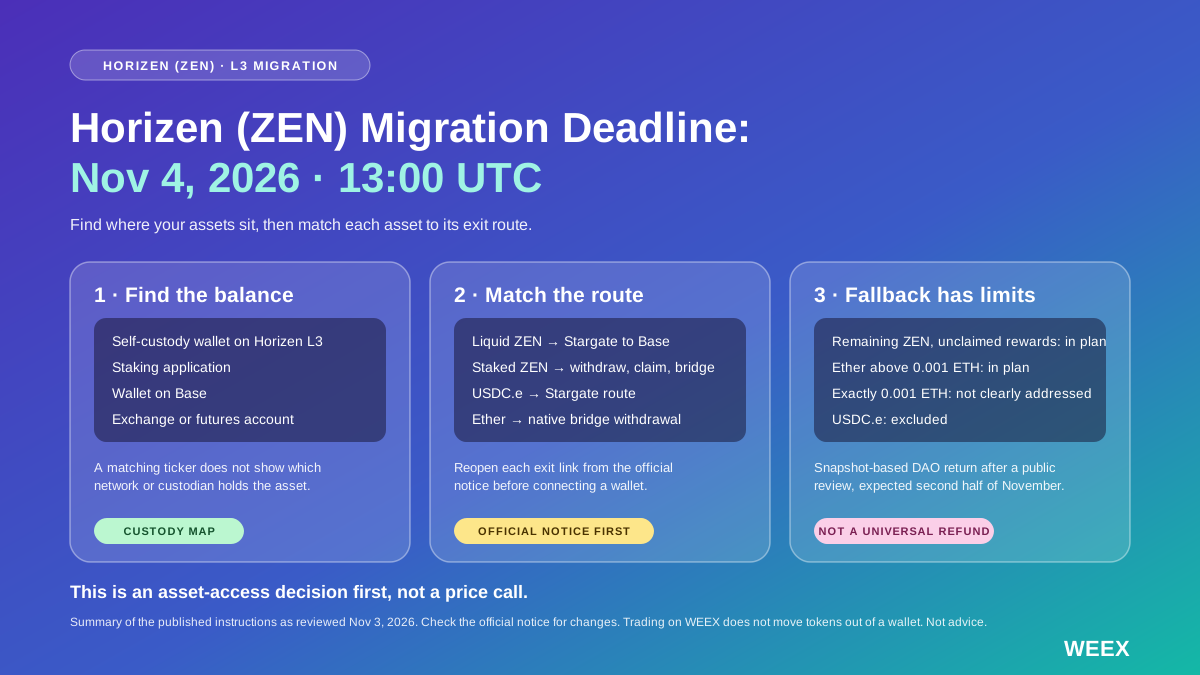
Horizen (ZEN) Migration Deadline: What to Move Before November 4 and What Happens If You Miss It
Horizen (ZEN) migration closes November 4. Check asset-specific bridge routes, wallet requirements, recovery exclusions and what to do if you miss it.
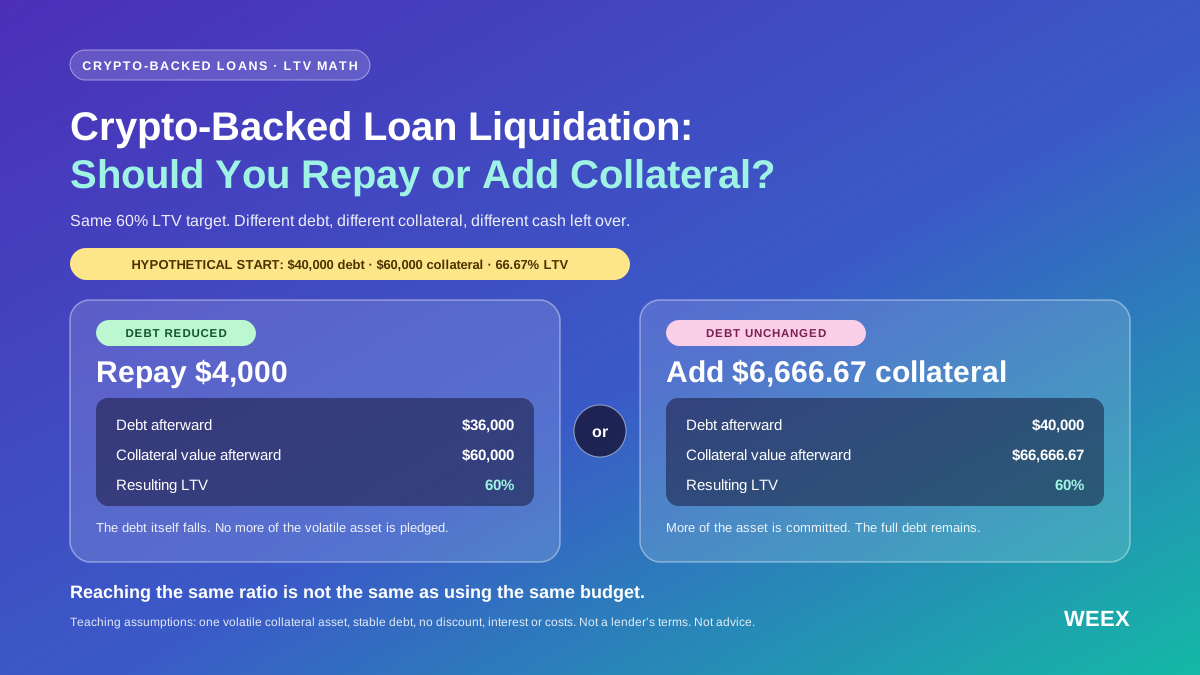
Crypto-Backed Loan Liquidation: Should You Repay or Add Collateral?
Facing crypto-backed loan liquidation? Compare repayment and collateral top-ups using equal budgets, LTV calculations, stress tests and protection limits.
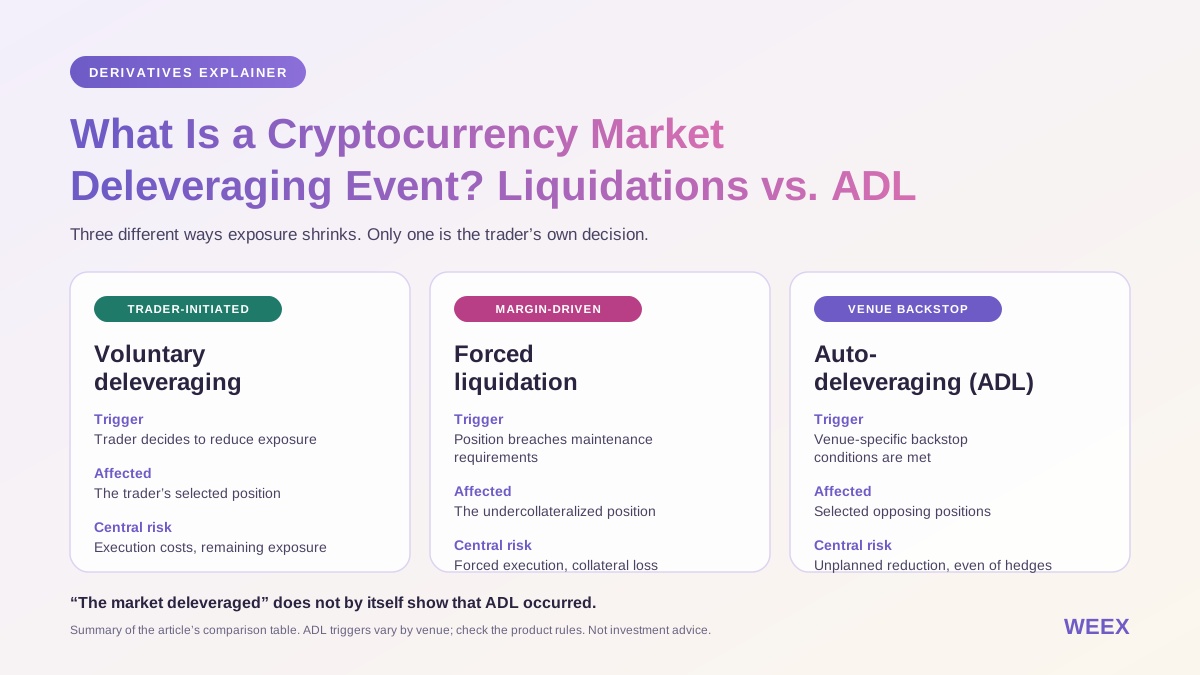
What Is a Cryptocurrency Market Deleveraging Event? Liquidations vs. ADL
Understand a cryptocurrency market deleveraging event: liquidation vs. ADL, misleading open-interest declines, hedge risks, and checks before trading.
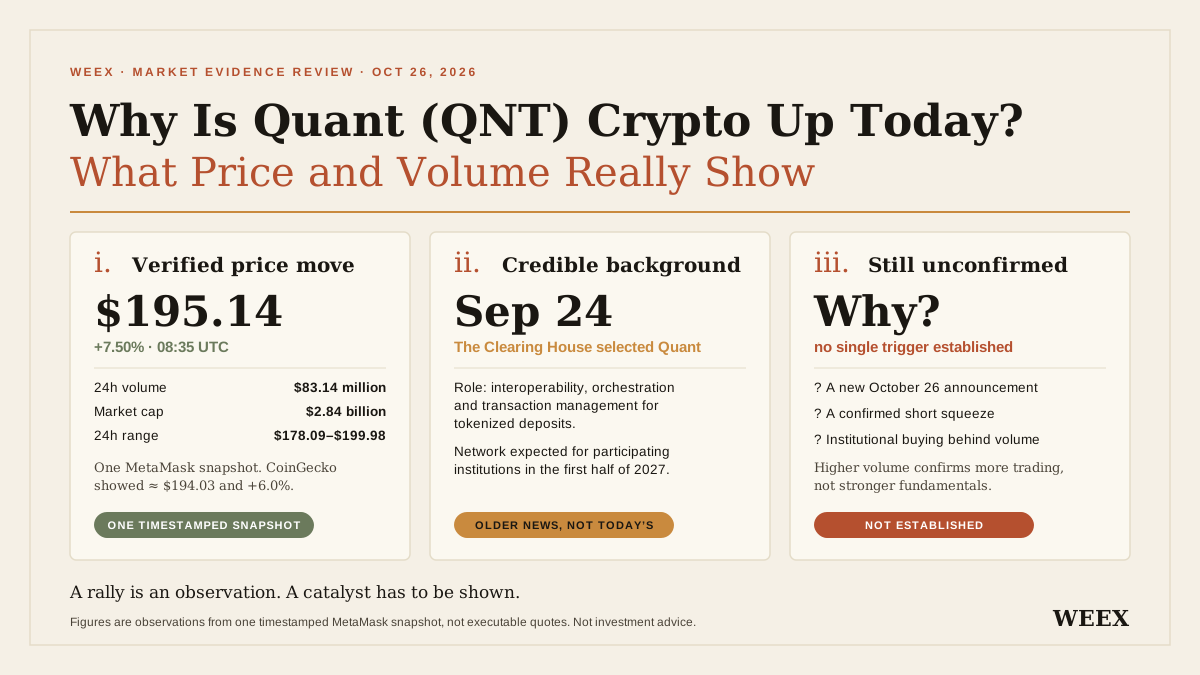
Why Is Quant (QNT) Crypto Up Today? What Price and Volume Really Show
Why is Quant (QNT) up today? Review price and volume evidence, the banking partnership timeline, token-demand assumptions, and risks before trading.
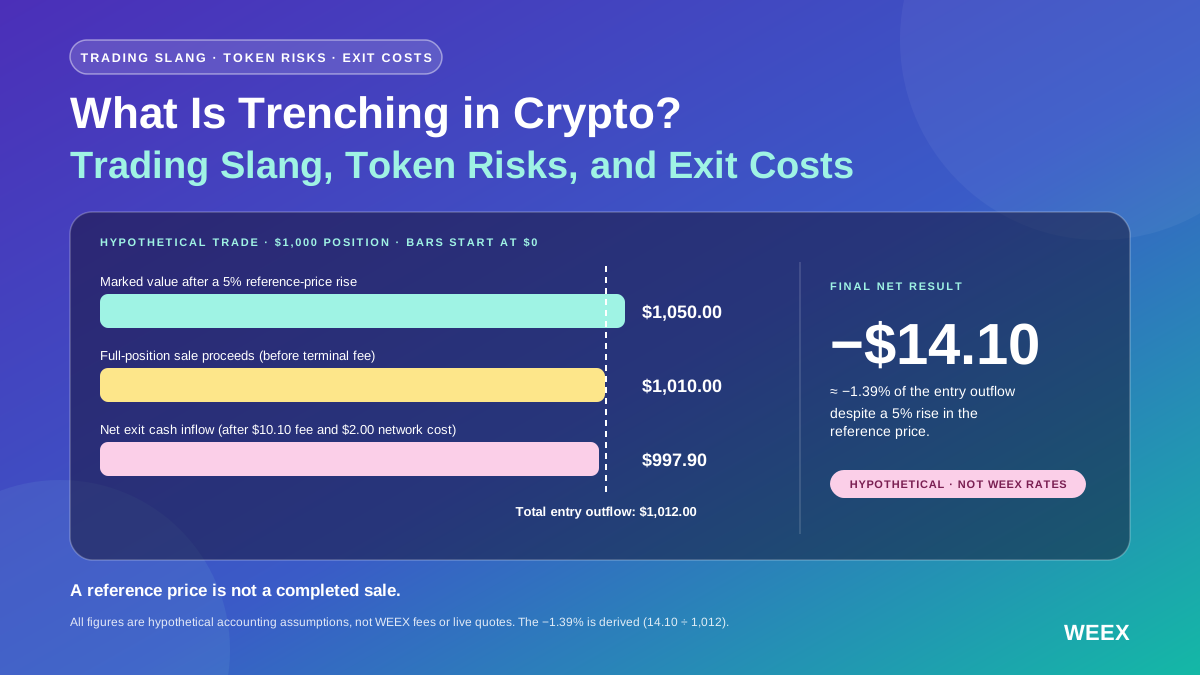
What Is Trenching in Crypto? Trading Slang, Token Risks, and Exit Costs
What is trenching in crypto? Learn the slang, token checks, liquidity risks, and how a rising token can still produce a loss after trading costs.
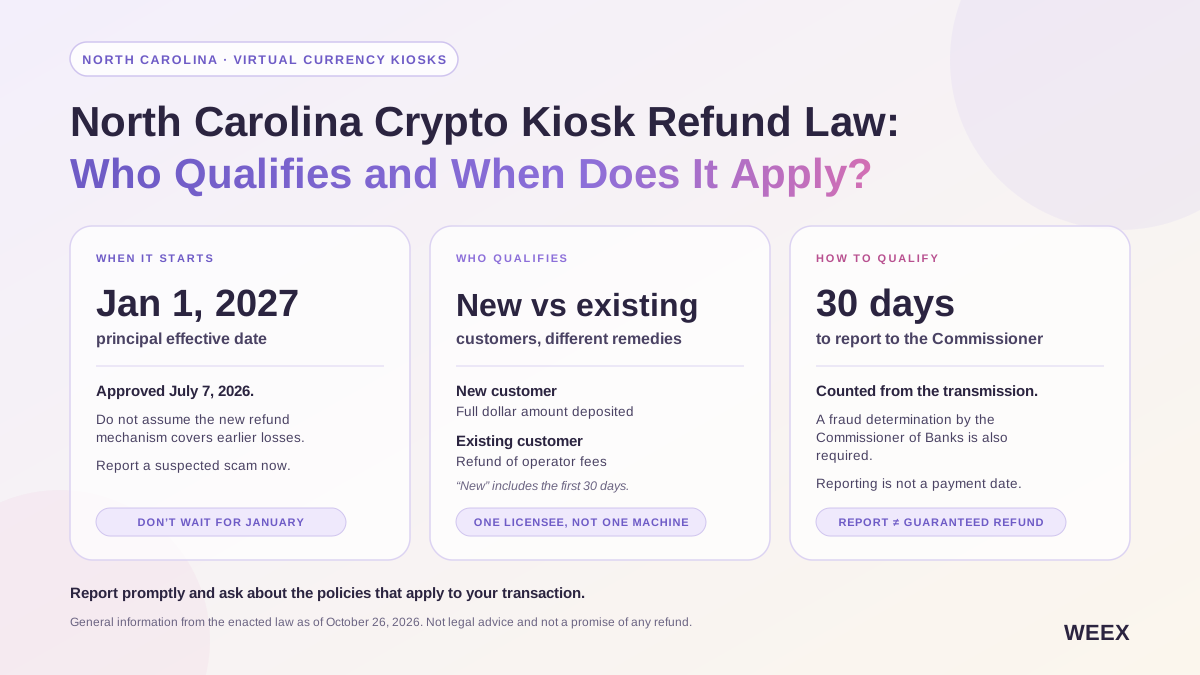
North Carolina Crypto Kiosk Refund Law: Who Qualifies and When Does It Apply?
Understand North Carolina’s crypto kiosk refund law: the January 2027 start date, who qualifies, reporting deadlines, and documents victims should keep.

Who Is Kimchi Crypto Trader? Age, Real Name, and Trading Background
Who is Kimchi crypto trader? Check what is known about his age, the name Clayton Kim, trading background, profit claims, and Pump.fun partnership.
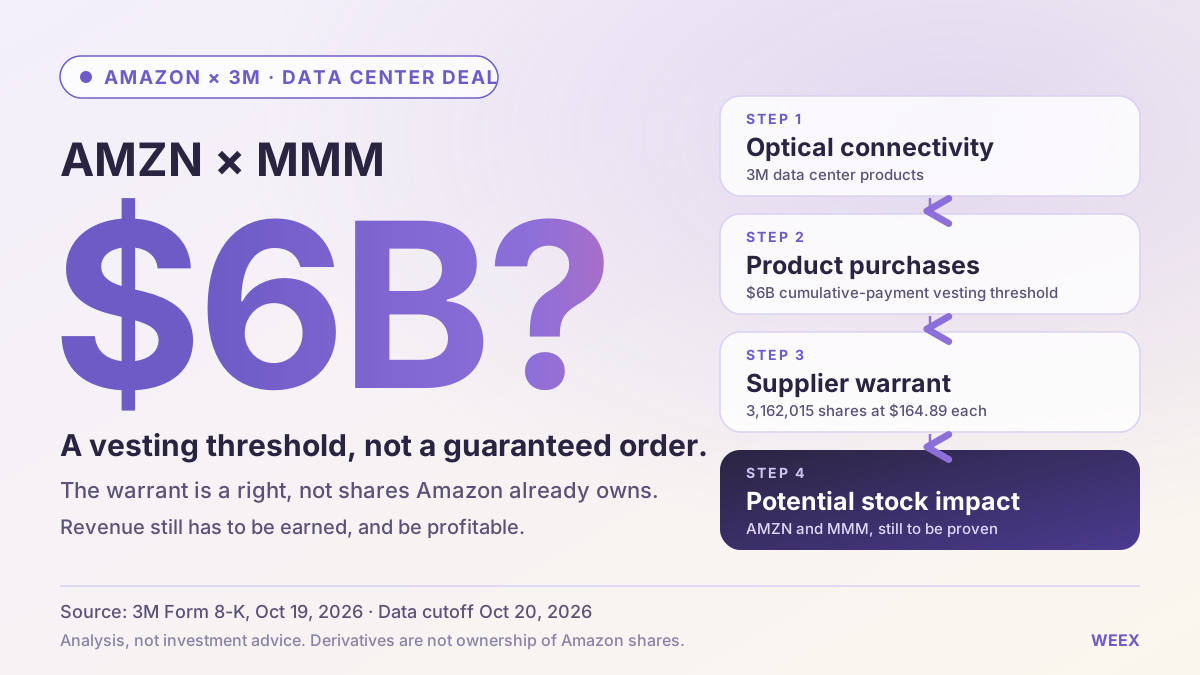
Amazon’s 3M Data Center Deal: What It Means for Amazon (AMZN) and 3M (MMM) Stock
Assess Amazon’s 3M data center deal, the $6 billion warrant threshold, potential dilution, and what the agreement could mean for AMZN and MMM stock.

CoreWeave vs. Nebius Stock: Which AI Cloud Business Faces Greater Financing Risk?
Compare CoreWeave and Nebius stock through debt, cash flow, customer prepayments and dilution to assess which AI cloud business faces greater financing risk.
Mercado Bitcoin Withdrawal Update: Pix Restart and Crypto Suspension
Mercado Bitcoin set November 17 for Pix deposits and withdrawals in Brazilian reais. Read the withdrawal rules and the background to the crypto suspension.
VICE 6 Crypto: Is VICE 6 (VTC) Linked to GTA 6? How to Verify the Token
Is VICE 6 crypto linked to GTA 6? Compare two Solana tokens using VTC, verify their mint and pool addresses, and see what Rockstar has confirmed.
Ethereum Price Near $1,800: What Could Confirm an Ethereum (ETH) Rebound?
Ethereum traded near $1,800 on November 16. See what four-hour spot order flow, futures positioning, and Friday’s ETF flows say about an ETH rebound.
TAO Crypto Price Near $190: Is Bittensor (TAO) Recovering or Just Bouncing?
TAO bounced near $190. Compare spot volume, futures positioning, and Bittensor subnet flows to see what would confirm a more durable recovery.
VVV Crypto: What Is Venice Token, Why Venice Token (VVV) Rose and What DIEM Actually Does
Venice Token rose about 14.6% in one November 15 snapshot. Learn what the data shows, how VVV staking works, and what DIEM’s daily API credit buys.
US Stock Market Index Today: Nvidia Stock Price Falls to $162.85 Ahead of Earnings(S&P 500 and QQQ )
Track US stock index futures, the S&P 500 and Dow, and see how Nvidia’s $162.85 close and November 17 earnings could shape QQQ and the broader market.
Latest articles
Latest coin listings on WEEX


