
SpaceX (SPCX) Stock Price Prediction 2027: How Much Can Starlink Growth Offset AI Spending?

 Prefer us on Google
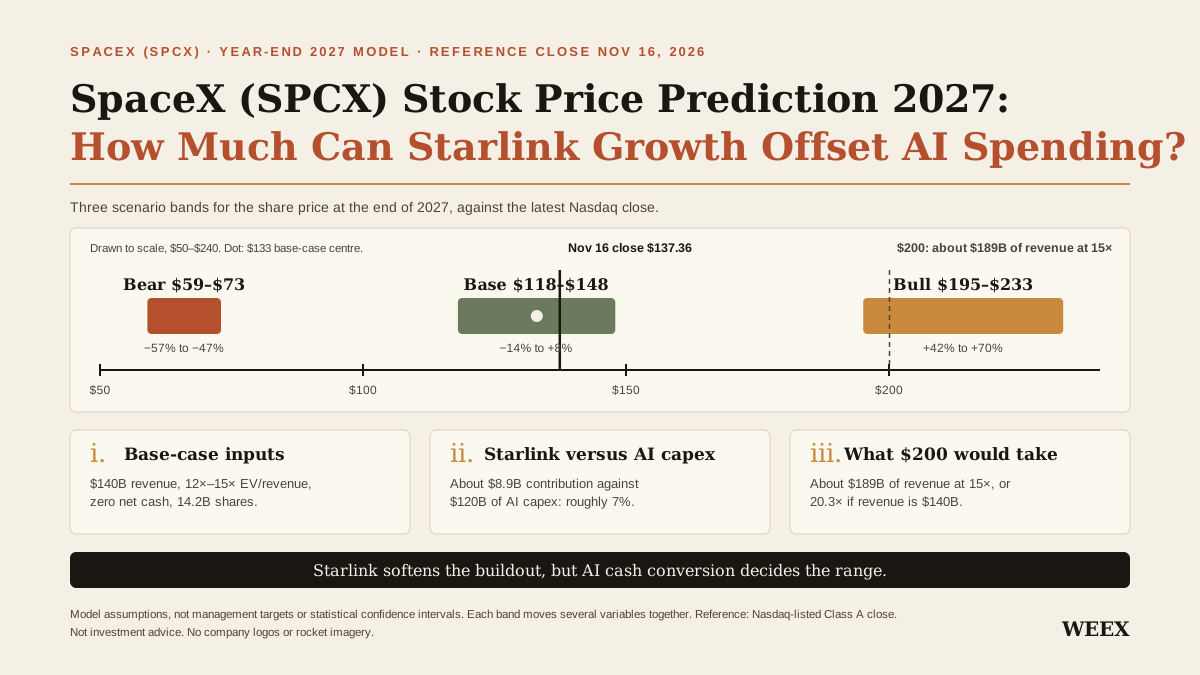
Our SpaceX (SPCX) stock price prediction for year-end 2027 is $118–$148 in the base case, with a central estimate of about $133 per share. That compares with the November 16, 2026 Nasdaq close of $137.36. The model assumes about $140 billion in 2027 revenue, including $26 billion from Starlink-led Connectivity, and no material net cash or net debt at year-end. A weaker operating and financing outcome points to $59–$73; a stronger one supports $195–$233.
Starlink is a valuable source of earnings, but its growth alone is unlikely to justify a much higher share price. SpaceX is spending heavily on AI infrastructure, and the stock already prices in substantial progress turning that spending into revenue. The question is how much of that revenue becomes cash after customers pay, hardware needs replacing, and the next round of capacity comes online. That is where the difference between a $133 stock and a $200 stock begins.
Key Takeaways
- Base case: $118–$148 by year-end 2027. The $133 midpoint is about 3% below the November 16 Nasdaq close, before any trading costs.
- Starlink can soften the cost of the AI buildout. In Q3 2026, Connectivity generated about $1.96 billion of adjusted EBITDA after subtracting its own capex as a rough proxy. The AI-led Super Intelligence segment spent $16.44 billion on capex in the same quarter.
- The base model puts that Starlink-led contribution at about $8.9 billion in 2027, against $120 billion of assumed AI segment capex. That is roughly 7% of gross AI capex, before accounting for the AI segment’s own earnings.
- A $200 stock needs more than subscriber growth. At the base share count and a 15× revenue multiple, it would require about $189 billion of 2027 revenue if year-end net cash is zero.
Where SpaceX (SPCX) Stock Stands Heading Into 2027
SpaceX closed at $137.36 on November 16, 2026, according to its Nasdaq share price history. That was about 1.7% above its $135 IPO price and 8.4% below its $150 first trade, which Nasdaq reported on the June listing day. Neither IPO figure sets a floor for the stock. They are useful as historical reference points; the more important starting point for the forecast is what today’s share price implies about the business.
The September quarter Form 10-Q disclosed about 13.58 billion Class A and Class B shares outstanding as of October 15. Applying the listed Class A price to that combined count gives a rough common-equity value of $1.87 trillion at the November 16 close. This is an illustrative market-cap estimate using the latest filing’s share-count date. It is distinct from the value of the publicly tradable float and from a fully diluted share count that includes potential future issuance.
A comparison with the June IPO can also obscure a change in the business itself. The Q3 filing includes Cursor in the Super Intelligence segment after the acquisition closed. That matters for a 2027 stock forecast: SpaceX now has more sources of AI revenue, and the transaction also affects how investors should think about share issuance and per-share value. Growth in the company’s operating value does not translate one for one into growth per share.
What SpaceX’s Latest Financials Say About Starlink and AI Spending
The Q3 2026 earnings release shows why the group cannot be modeled as a satellite broadband company alone. SpaceX reported about $14.58 billion in quarterly revenue, up 161% year over year, and $2.79 billion in operating income. Super Intelligence, or SI, accounted for just over half of revenue and roughly 84% of reported group capex for the quarter. Connectivity, which includes more than consumer Starlink subscriptions, produced the largest segment operating profit.
| Q3 2026, USD billions | Space | Connectivity | Super Intelligence | Group |
|---|---|---|---|---|
| Revenue | $1.77 | $5.25 | $7.56 | $14.58 |
| Operating income | Approximately breakeven | $2.37 | $0.43 | $2.79 |
| Adjusted EBITDA | $0.36 | $3.50 | $4.95 | $8.81 |
| Capital expenditure | $1.61 | $1.54 | $16.44 | $19.59 |
The split makes clear which business was earning money and which was absorbing the most investment. Connectivity reported an operating margin of about 45% for the quarter. SI reported a much higher adjusted EBITDA figure than operating income, partly reflecting depreciation and acquisition-related share compensation. For an infrastructure business, those differences matter. Equipment depreciation is noncash in the quarter it is booked, but the equipment still had to be paid for and may eventually need replacing.
The consolidated cash-flow statement gives a separate check. In the first nine months of 2026, SpaceX reported $13.10 billion in operating cash flow and $48.07 billion in purchases of property, plant, and equipment. Subtracting the latter gives a simple negative $34.97 billion cash measure before separate items such as product rebates and capitalized interest. It is not presented here as the company’s official free cash flow. Its purpose is to show the gap between cash generated by operations and cash deployed on physical assets. The company also recorded a working-capital benefit from customer upfront payments, which readers should consider before treating the reported operating cash flow as a steady run rate.
How Much of the AI Buildout Can Starlink Fund?
In Q3 2026, Connectivity generated approximately $3.50 billion in adjusted EBITDA and spent $1.54 billion on its own capital projects. Subtracting one from the other leaves $1.96 billion. This measures the potential contribution after the segment’s own hardware and infrastructure investment, before items such as taxes, working capital, interest and other cash adjustments. SpaceX does not report the figure as standalone Starlink free cash flow.
On that basis, Connectivity’s quarterly contribution equaled about 12% of SI’s $16.44 billion in gross capex. A second comparison gives the businesses’ combined burden more context. SI’s own adjusted EBITDA of $4.95 billion narrows its illustrative capex gap to $11.49 billion. Applying the full $1.96 billion Connectivity proxy against that gap would still leave about $9.54 billion uncovered. This is a scale comparison across segments, not evidence that SpaceX earmarked Starlink receipts for any specific AI project.
Why more subscribers do not automatically mean more cash for AI
SpaceX reported 13.6 million Starlink consumer subscribers at the end of September 2026. The filing showed consumer subscriber growth of 88.9% year over year and a 16.9% decline in consumer average revenue per user, or ARPU. Those two trends can coexist: Starlink can reach more households by entering new markets or selling lower-priced plans, while the average customer pays less. The subscriber count becomes more useful when read alongside pricing, equipment costs and the capital needed to sustain service quality.
Enterprise and government services add another source of growth. In the filing, the increase in quarterly Connectivity revenue was split between about $1.14 billion from consumer subscribers and $1.02 billion from enterprise and government business. That mix matters for the forecast. Airlines and other commercial customers can raise segment revenue without relying on higher household plan prices. But connecting more customers can also require more terminals, links and constellation capacity. The model credits Starlink-led Connectivity for both sides of the equation: it grows revenue and continues spending to deliver it.
The 2027 funding bridge
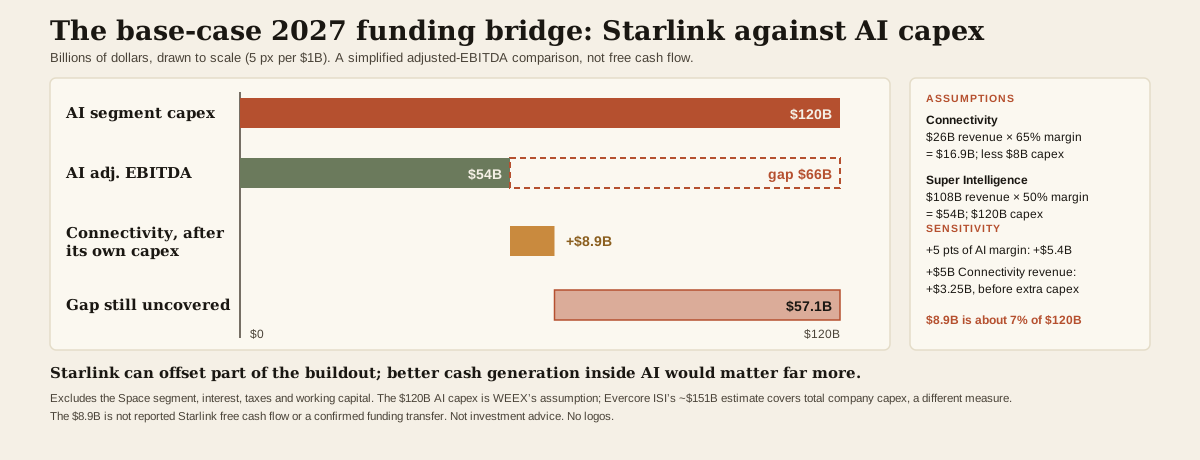
Our base case assumes $26 billion in Connectivity revenue, a 65% adjusted EBITDA margin and $8 billion of Connectivity capex. The margin sits close to the Q3 result of roughly 67%, with allowance for a less favorable mix over a full year. Under those assumptions, Connectivity produces $16.9 billion in adjusted EBITDA and an $8.9 billion contribution after segment capex on the same simplified basis.
For SI, the base case assumes $108 billion in revenue, a 50% adjusted EBITDA margin and $120 billion in capex. That gives $54 billion of adjusted EBITDA against $120 billion of spending, leaving a $66 billion gap before applying any Connectivity contribution. After the $8.9 billion proxy, the gap is about $57.1 billion. The AI capex assumption is ours. For context, Reuters reported an Evercore ISI estimate of about $151 billion in total company capital spending for 2027, a different measure from the SI spending used here.
These figures stop short of a forecast for consolidated free cash flow: the calculation leaves out Space segment economics, interest, taxes, working capital and other cash items. It is meant to answer the narrower question in the headline. Starlink can offset part of the buildout cost, but better cash generation within AI itself would make a much larger difference. For instance, a five-point increase in SI’s adjusted EBITDA margin on $108 billion in revenue would add $5.4 billion to that segment’s contribution. By comparison, another $5 billion of Connectivity revenue at a 65% margin would add $3.25 billion before any additional capex.
SpaceX (SPCX) Stock Price Prediction: Bear, Base and Bull Cases
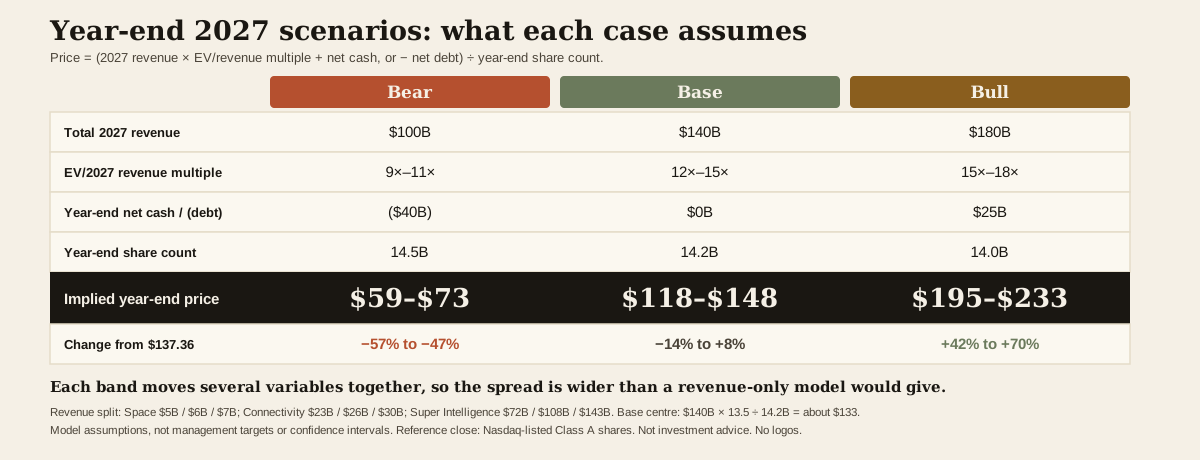
The model values the whole operating business using enterprise value to 2027 revenue, then adjusts for net cash or debt and divides by estimated year-end shares. Revenue is the starting point because near-term earnings and free cash flow can swing substantially with the timing of deployments, depreciation and funding. The drawback is that a revenue multiple does not directly measure profitability. To account for that, the scenarios assign different multiples depending on customer retention, cash conversion and financial risk.
Implied share price = (2027 revenue × EV/revenue multiple + year-end net cash, or − net debt) ÷ year-end share count.
| 2027 model input | Bear case | Base case | Bull case |
|---|---|---|---|
| Space segment revenue | $5B | $6B | $7B |
| Connectivity revenue | $23B | $26B | $30B |
| Super Intelligence revenue | $72B | $108B | $143B |
| Total revenue | $100B | $140B | $180B |
| EV/2027 revenue multiple | 9×–11× | 12×–15× | 15×–18× |
| Year-end net cash/(debt) assumption | ($40B) | $0B | $25B |
| Year-end share count assumption | 14.5B | 14.2B | 14.0B |
| Implied year-end stock price | $59–$73 | $118–$148 | $195–$233 |
| Approximate change from $137.36 | −57% to −47% | −14% to +8% | +42% to +70% |
These are model assumptions, not management targets or statistical confidence intervals. The bands also move several variables together: a weaker business can earn a lower multiple while needing more financing, and a stronger business can support a higher valuation with less dilution. That is why the spread is wider than it would be in a model that changes revenue alone.
Bear case: $59–$73 if the AI ramp falls short
The bear case assumes 2027 revenue lands at $100 billion as customer demand, energization timelines or deployment delays hold back SI. To see how much of a miss that represents, management gave $33–$37 billion in Q1 2027 revenue guidance on the October earnings call. If Q1 came in at the $35 billion midpoint, a $100 billion year would leave only $65 billion for the remaining three quarters, or about $22 billion per quarter. This scenario assumes a material miss against the planned ramp, a sharp slowdown after a strong Q1, or some combination of the two. It is a stress case.
Customer concentration is a concrete reason to keep that stress case. The Form 10-Q showed an unnamed customer accounting for 34.5% of Q3 consolidated revenue. The filing also says cloud-services contracts are typically terminable by either party on 90 days’ notice. That general description does not establish the precise terms of the unnamed customer’s contract, but it does explain why investors should pay attention to retention and utilization instead of assuming all announced capacity is locked into long-lived cash flow.
Base case: $118–$148 as revenue scales and cash conversion lags
The $140 billion base case is consistent with averaging $35 billion per quarter in 2027, equal to the midpoint of management’s Q1 guidance. It effectively assumes the initial step up is largely sustained over the year. It does not extrapolate the same rapid step up every quarter. At the midpoint 13.5× multiple, the calculation is $140 billion × 13.5 ÷ 14.2 billion shares = about $133.10.
At September 30, SpaceX reported approximately $89.9 billion in cash and cash equivalents plus short-term marketable securities, against about $38.8 billion in debt and finance leases at carrying value. That yields a simple reported-balance net cash comparison of about $51 billion, before other items. The base model’s zero year-end 2027 net cash is a forward assumption. It allows for cash use while the company builds capacity. The forecast also uses 14.2 billion shares at year-end, above the October reported count, to allow for potential dilution. That is a modeling assumption and does not assert an announced issuance.
Bull case: $195–$233 if AI capacity produces repeatable revenue
The bull case reaches $180 billion of annual revenue, including $143 billion from SI. At the $35 billion Q1 guidance midpoint, that would leave $145 billion to generate in the remaining three quarters, or roughly $48 billion per quarter. That is a visible hurdle. It would require new capacity to come online and earn revenue, customers to renew or expand workloads, and margins to hold as deployment scales. A strong Starlink year helps, but the move from the base case to the bull case is primarily an AI revenue and cash-conversion story.
What Would It Take for SpaceX (SPCX) Stock to Reach $200?
At $200 per share and the base-case 14.2 billion shares, implied equity value would be $2.84 trillion. With zero net cash, that is also the implied enterprise value in this simplified comparison. It would take about $189 billion of 2027 revenue at a 15× multiple, or roughly 20.3× revenue if sales instead come in at the base-case $140 billion.
That gives the $200 thesis two distinct tests. One is operational: SpaceX generates substantially more revenue than the base case and keeps enough of the economics to sustain a premium multiple. The other is a valuation decision: investors accept a much higher multiple because they expect strong growth and improving cash flow beyond 2027. A rising share price does not tell us which explanation the market is using. Subsequent earnings, capex and financing figures do.
The same calculation explains why the current price leaves less upside than space or AI headlines might suggest. At $137.36, the base-case share count and zero net cash imply a hurdle of about 13.9× the model’s $140 billion revenue assumption. If revenue lands at $140 billion but investors value those sales at 10×, the model gives roughly $99 a share. The revenue forecast can be right and the stock price forecast still miss because the market assigns those sales a different value.
The 2027 Signals That Would Change the Forecast
The first test is whether reported Q1 revenue validates the $33–$37 billion guidance and whether SI drives a durable increase after that. The quality of the number matters: higher sales across a wider range of customers would support a stronger case than the same revenue concentrated in one large account. Track whether power and compute capacity become usable, contracted capacity. Infrastructure installed but not yet generating revenue still represents capital tied up in the business.
The second test is the gap between operating cash flow and investment spending. If operating cash flow improves while capex rises even faster, SpaceX may still need significant external financing. If cash conversion strengthens and spending starts to produce more revenue per dollar deployed, a higher price range becomes easier to defend. Quarterly net cash and shares outstanding are useful cross-checks. At the base-case enterprise value of $1.89 trillion, increasing the share count from 14.2 billion to 14.7 billion, with no offsetting change in net cash or operating value, takes the implied price from about $133 to $129.
Finally, pay attention to what Starship milestones can establish. A successful flight can reduce technical uncertainty and strengthen the case for a lower cost per unit of satellite capacity. The financial payoff depends on repeatable launch cadence, refurbishment costs and how much usable capacity SpaceX can sell. The base forecast gives no separate premium for a future Tesla combination or for Starlink becoming a separately listed company. Either would require its own analysis using confirmed terms.
Trading SpaceX Exposure on WEEX
This forecast uses Nasdaq-listed SpaceX Class A shares as its reference. Eligible users can find the SPCX/USDT perpetual on WEEX Futures for long or short exposure without owning the listed share. Before placing an order, compare the contract’s live price with the cash-market quote, then review the available margin settings, funding and liquidation terms. A gap between the prices can affect trading results even if the long-term stock thesis is correct.
WEEX also lists SPCXON/USDT on Spot, a separate tokenized product from Ondo. Review the product terms, availability and order book before using it. Neither a perpetual contract quote nor a tokenized product quote should replace the Nasdaq share price in this forecast.
WEEX Editorial View
At $137.36, SpaceX already trades inside our $118–$148 base band. We would need to see more than another period of fast subscriber growth to move that range higher. Starlink makes the AI buildout easier to fund, but the larger valuation question is whether the AI business can turn more of its sales into cash while it is still expanding.
The evidence that would push the forecast toward $200 is a combination of SI revenue tracking above the base case, less reliance on a single customer, and a narrowing gap between group operating cash flow and capital spending. Until those signals show up together, the current share price already reflects a substantial amount of the growth investors are counting on.
FAQ
1. What Is the SpaceX (SPCX) Stock Price Prediction for 2027?
The base-case year-end 2027 forecast is $118–$148, with a central estimate near $133. It assumes $140 billion in 2027 revenue, a 12×–15× EV/revenue multiple, no material net cash or net debt at year-end, and approximately 14.2 billion shares.
2. Can SpaceX (SPCX) Reach $200 in 2027?
Yes, under the stronger assumptions in this model. At 14.2 billion shares and zero net cash, a $200 price requires about $189 billion of annual revenue at a 15× multiple, or a multiple of about 20.3× if revenue is $140 billion.
3. Can Starlink Pay for SpaceX’s AI Spending?
It can offset some of it. Our base case estimates an $8.9 billion Connectivity contribution after its own capex on an adjusted EBITDA basis, compared with $120 billion of modeled SI capex. The $8.9 billion is not reported Starlink free cash flow or a confirmed internal funding transfer.
4. Is the $135 IPO Price a Floor for SpaceX (SPCX) Stock?
No. The $135 figure was the IPO offer price. Investors can trade the stock above or below it as expectations for revenue, cash flow, dilution and the valuation multiple change.
5. Does This Forecast Apply to SPCX Futures or Tokenized SpaceX Products?
The targets apply to Nasdaq-listed SpaceX shares. Futures and tokenized products can track the same underlying company while trading at different prices. Contract specifications, trading hours, funding, liquidity and product terms can all affect the result.
This content is provided for general informational purposes only and doesn't constitute financial, investment, legal, or tax advice. Any events, rewards, online promotions, or related information mentioned herein should not be considered a recommendation, solicitation, or invitation to purchase, sell, trade, or otherwise deal in any crypto assets. Crypto assets are highly volatile and may result in loss. The availability of WEEX services, products, and related events may vary by region. You are responsible for ensuring that your participation is in accordance with applicable local laws and regulations.
You may also like
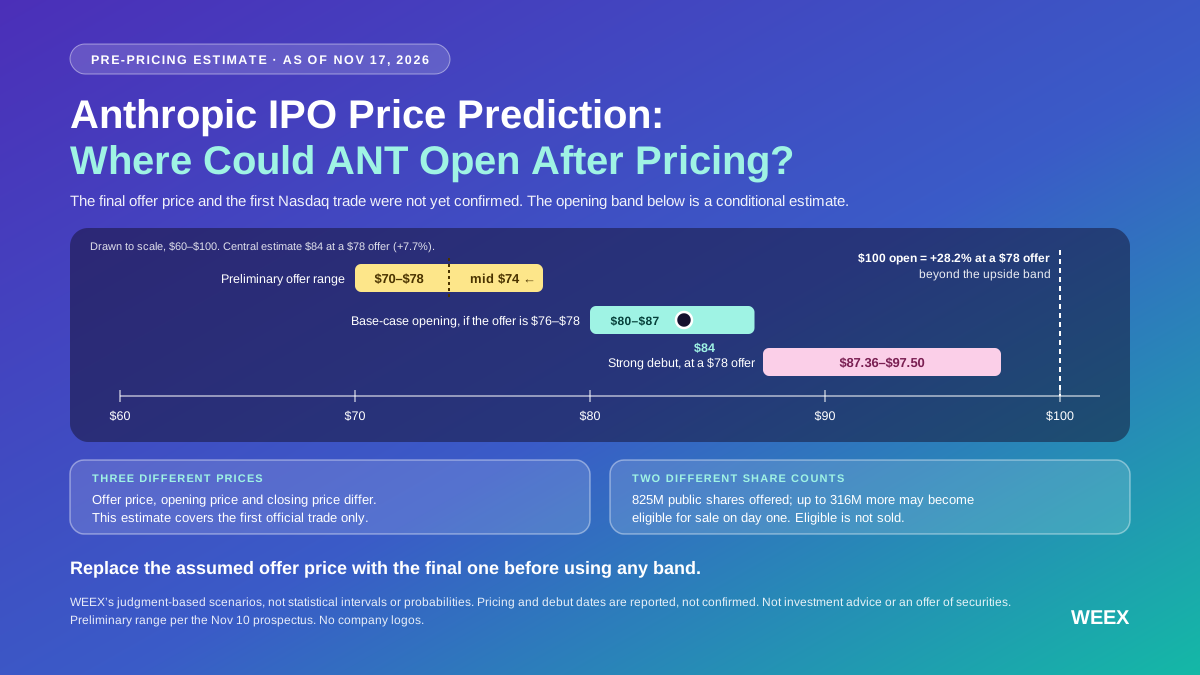
Anthropic IPO Price Prediction: Where Could ANT Open After Pricing?
Anthropic IPO price prediction: See ANT’s $80–$87 base-case opening range, how the final offer price changes it, and what could push shares above $90.

Major Indexes Close Lower, Nvidia Earnings Are Imminent | WEEX Daily Market Brief (November 17, 2026)
At the November 16 close, the three major indexes all finished lower. Technology-stock selling continued, with the chip sector leading declines. Bitcoin’s weekend selloff showed signs of stop-loss hunting; it is currently around $64,000. Backpack received regulatory approval. On November 17, watch for October retail sales data and earnings from Nvidia, Home Depot, Disney, and JD.com.

Bitcoin Falls to $62,000 Over the Weekend; Rumors of Former Nvidia CEO’s Return | WEEX Daily Market Brief (November 16, 2026)
Crypto markets continued to decline amid low weekend liquidity, with Bitcoin probing lower levels. The DeFi sector rebounded first. Stock indexes showed mixed performance last week, with notable volatility in the AI sector. Anthropic is expected to list this Thursday. On November 16, watch Baidu and Trip.com earnings, as well as the execution period for the Coinbase CEO’s stock sale plan.

NVDA Earnings, Retail Sales and FOMC Minutes | WEEX Weekly Market Hotspot Preview (2026.11.16-11.20)
WEEX’s weekly market hotspot preview focuses on retail sales, Microsoft Ignite, NVDA earnings, FOMC minutes, WMT and PANW earnings, final consumer sentiment, and the ZRO unlock. After another volatile stretch for AI trades, markets will reprice AI demand, consumer resilience, rate expectations, and crypto risk appetite, putting QQQ, BTC, ETH, NVDA, MSFT, HD, WMT, PANW, and ZRO in focus.
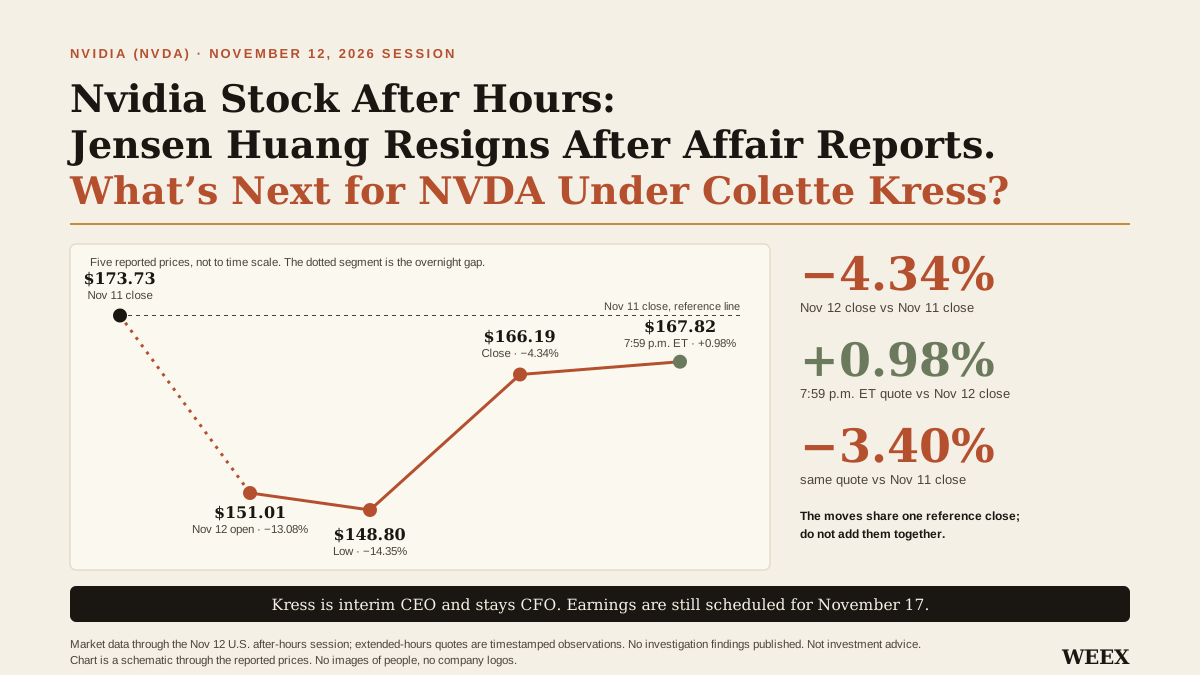
Nvidia Stock After Hours: Jensen Huang Resigns After Affair Reports. What’s Next for NVDA Under Colette Kress?
Nvidia fell 4.34% after Jensen Huang resigned, then rose 0.98% after hours. See what Colette Kress’s appointment means for NVDA and November 17 earnings.

Nvidia CEO Resignation Impacts Tech Stocks; Bitcoin Falls to $70,000 Support | WEEX Daily Market Brief (November 13, 2026)
Technology-stock selling pushed Bitcoin down to the $70,000 support level, while Ethereum briefly fell below $2,000. Spot Bitcoin ETFs recorded net outflows for the fifth consecutive trading day. Nvidia CEO’s resignation triggered sharp share-price volatility. Nebius’s full-year guidance missed expectations. The October PPI is the key release to watch on November 13.

CoreWeave Earnings Drive an AI Rebound, Bitcoin Trades in a Narrow Range | WEEX Daily Market Brief (November 12, 2026)
At the November 11 close, the three major indexes all closed higher. CoreWeave’s strong earnings drove a rebound in technology stocks. Bitcoin treasury companies’ purchase-to-sale ratio fell below 90%. ZEC lost the $1,000 level. GRAM rebounded in the short term. On November 12, watch for Nebius and Ondas before the open, and Cerebras, Applied Materials, and Cisco after-hours earnings.

CPI Exceeds Expectations, Three Major Indexes and Bitcoin Lower | WEEX Daily Market Brief (November 11, 2026)
October CPI rose 0.4% month over month, above expectations. Bond yields climbed, and the three major indexes all closed lower. Bitcoin briefly fell below $73,000. CoreWeave’s third-quarter revenue beat expectations. TSMC’s October revenue was strong. The bond market is closed on November 11; watch for Rumble’s earnings report.

Middle East Easing Expectations Boost Stocks | WEEX Daily Brief (November 10, 2026)
On November 9 close, the S&P 500 and Dow both rose more than 2%. Middle East easing expectations pushed oil prices lower. Bitcoin and Ethereum spot ETFs saw net outflows last week. AVAX rose on reports of tokenized-stock clearing. PIEVERSE surged short-term. November 10 focus is October CPI, TSMC monthly sales data, CoreWeave earnings and others.

CPI, PPI and AI Infrastructure Earnings | WEEX Weekly Market Hotspot Preview (2026.11.09-11.13)
WEEX’s weekly market hotspot preview focuses on CPI, PPI, AI infrastructure earnings, and the MSCI index review. After last week’s sharp tech volatility, markets will reprice inflation pressure, AI capex returns, and risk appetite, putting QQQ, BTC, ETH, CRWV, CSCO, AMAT, NBIS, and CBRS in focus.

Bitcoin Falls for Five Consecutive Weeks, Berkshire Cash Hits New High, Focus on RKLB, CEG Earnings | WEEX Daily Market Brief (November 9, 2026)
Bitcoin and Ethereum spot ETFs saw net outflows last week. Analysts discuss cycle positioning. PEPE rebounded short-term. Nvidia was lower pre-market. Berkshire’s third-quarter cash holdings hit a new high. Anthropic plans to launch an IPO. November 9 focus is CEG and KKR pre-market, and OXY, RKLB and others after hours.

AI Policy Risk Sparks Selloff, BTC Breaks $76K | WEEX Weekly Recap (2026.11.02-11.06)
The market quickly shifted from post-election risk recovery to AI policy risk and data-center restriction pricing. After Democrats gained a clear seat advantage in the midterms, risk assets first traded lower uncertainty, but data-center limits, tighter AI regulation risk, and tech valuation pressure became the new selloff triggers. Thursday’s tech and AI-chain decline pulled BTC below $76,000, moving the market from earnings trades into a second-wave volatility window.
Stocks Crash; Bitcoin Plummets to $76K Support | WEEX TradFi Daily Brief (November 6, 2026)

Major Indexes Rise After Election Clarity, Oil Plunges| WEEX Daily Market(November 5, 2026)
At the November 4 close, all three major indexes rose. Risk assets rebounded after election clarity, but AI-related stocks broadly declined. Brent and WTI oil both fell more than 9% over 24 hours. Bitcoin briefly rose above $80,000, and the crypto market warmed across the board. TRUMP token plunged. November 5 focus is earnings from Moderna, Sony, ConocoPhillips and others.

Tech Stocks Rebound,ARM Earnings in Focus | WEEX Daily Market Brief (November 4, 2026)
At the November 3 close, equity indexes were mixed and divergent, while tech and semiconductors rebounded. Nvidia rose about 2.29%, with market cap returning above $5 trillion. AMD and Super Micro Computer surged after hours. Bitcoin is focused on the $76,000–$77,000 range. November 4 focus is pre-market earnings from Uber, McDonald’s and others, plus after-hours results from Arm, MercadoLibre and others.

Bitcoin Falls to $77,000, Nasdaq Enters Technical Correction | WEEX Daily Market Brief (November 3, 2026)
Bitcoin has fallen for four consecutive weeks. The Nasdaq-100 entered a technical correction, with semiconductors and optical communications under pressure. Apple fell further after hours despite beating expectations, while Palantir posted strong results but declined after hours. Anthropic pre-market contracts fell. Oil fell more than 4% on negotiation signals. November 3 focus is earnings from AMD, Shopify and others.

Midterm Elections, Payrolls and AI Earnings | WEEX Weekly Market Hotspot Preview (2026.11.02-11.06)
WEEX’s weekly market preview focuses on midterm elections, ISM manufacturing and services PMI, JOLTS job openings, payrolls, and earnings from AAPL, PLTR, AMD, SMCI, ARM, QCOM, UBER and NET. After last week’s pressure on tech stocks, markets will trade policy uncertainty, AI investment returns, labor data and crypto risk appetite more directly, with QQQ, BTC, ETH, AAPL, PLTR, AMD, SMCI, ARM, QCOM, NET and ZEC set for more active volatility.

Apple Regains Market-Cap Lead, Silver Back Near $50 | WEEX Daily Market(November 2, 2026)
At the October 31 close, Apple’s market cap once again surpassed Nvidia during the tech pullback. Alphabet fell more than 10% last week. Silver returned near $50. TRUMP token rose more than 10% over 24 hours. OP turned higher after stabilizing. November 2 focus is Marriott before the open and after-hours earnings from Apple, Palantir and others.

AI Earnings Diverge, Tech Sells Off, BTC Breaks $80K | WEEX Weekly Recap (10.26-10.30)
WEEX’s weekly recap tracks AI investment, rate expectations, and crypto. The Nasdaq rose for two sessions early in the week, but concerns about inflation, GOOGL’s sharp drop, and weak after-hours reactions to AMZN and INTC pushed volatility higher. BTC briefly fell below $80,000. As of the morning of October 30, the ECI, Chicago PMI, and XOM and CVX earnings were still pending.

Major Indexes Close Lower as Tech Comes Under Pressure | WEEX TradFi Daily(October 30, 2026)
All three major indexes closed lower on October 29, led down by technology and communication services; healthcare and defensive sectors were relatively resilient. Amazon and Intel came under pressure after hours. HYPE continued to rally toward its record high. TRX rose against the broader crypto-market decline. Investors will watch pre-market earnings from AbbVie, Exxon Mobil, Chevron and others on October 30.

Federal Reserve Holds Rates; AMZN, MSTR Earnings in Focus | WEEX TradFi Daily (October 29, 2026)
All three major indexes closed higher on October 28. The Federal Reserve held its policy rate at 3.75%–4%. Bitcoin briefly rose above $81,000 before pulling back. Storage, optical communications and Neocloud stocks strengthened broadly, with SK Hynix up more than 10%. Google fell about 9%–10% after hours, while Microsoft rose about 4%. Investors will watch after-hours earnings from Amazon, Intel and others on October 29.

SK Hynix Revenue Tops 104 Trillion Won,BTC Holds Near $80,000 | WEEX TradFi Daily (October 28, 2026)
All three major equity indexes closed higher on October 27, led by the Nasdaq. SK Hynix reported third-quarter revenue of 104.6 trillion won and operating profit of 83.3 trillion won, and announced a large-scale shareholder return program. Boeing shares fell about 10.7% after the company lowered delivery targets, hitting an 18-month low. Bitcoin was near $80,200. Meme and Robinhood ecosystem coins strengthened. The October 28 focus is the Federal Reserve decision and after-hours earnings from Google, Microsoft and others.
Anthropic IPO Filing Lifts AI Sentiment; BTC Holds Near $80,000 | WEEX TradFi Daily (October 27, 2026)
All three major indexes closed higher on October 26. Anthropic formally filed for a listing, rekindling AI speculation; the Philadelphia Semiconductor Index rose about 3% on the day, and Tesla reached a more-than-three-month high. Bitcoin was near $80,200, down for three consecutive weeks and testing $80,000 for a third time. Local assets plunged after the election result. The October 27 focus is the opening of the Federal Reserve meeting and earnings from Visa, PayPal and others.
Fed Decision, GDP and PCE Set the Tone | WEEX Weekly Market Preview (10.26-10.30)

Gold Breaks Below $4,000, Bitcoin Pulls Back Below $80,000 | WEEX TradFi Daily(October 26, 2026)
At the October 23 close, major indexes were mixed, with the Dow weaker. Brent crude rose to about $116.7, a near six-month high, and energy led; gold briefly fell below $4,000 as Bitcoin pulled back toward $80,000. Cybersecurity stocks strengthened last week, with CrowdStrike up nearly 12%. Markets are watching whether Bitcoin’s correction is nearing its end, along with earnings from Verizon, Cadence, Celestica and Amkor today.

Risk-Off Sentiment Spreads as Tech| WEEX TradFi Daily(October 23, 2026)
At the October 22 close, the Nasdaq fell about 2.6%, its steepest daily decline since June. Investors reassessed the potential returns on heavy AI investment, while spending commitments from companies such as Meta added to credit concerns. Risk aversion pushed long-bond yields lower, while Brent and WTI reached roughly five-month highs, with WTI nearing $100 a barrel. Bitcoin hovered around $81,000–$82,000, while gold and silver also weakened. Today’s pre-market focus is AXP and SLB earnings.

AI Spending Fears Hit Tech and BTC | WEEX Weekly Recap (2026.10.19-2026.10.23)
WEEX’s weekly recap covers AI spending, technology earnings, crypto assets, and oil. Tech stocks rebounded before selling off sharply: SpaceX results briefly lifted AI sentiment, while Meta, Tesla, and Lam Research drew mixed reactions. The Nasdaq then dropped, BTC retreated toward $81,000–$82,000, oil climbed, and gold and silver weakened.
Major Indexes Close Higher; Focus on TSLA, META Stock Earnings | WEEX TradFi Daily(October 22, 2026)
The three major indexes closed higher on October 21, led by the Nasdaq. SpaceX beat earnings expectations and disclosed AI-business revenue; merger discussions with Tesla also helped lift AI and crypto-related stocks. Bitcoin traded near $84,000 and Ethereum near $2,470. LIT led majors on compliance-license expectations. On October 22, investors will watch Procter & Gamble, Southern Copper and Union Pacific before the open, followed by Western Digital and Newmont after the close.
SpaceX Q3 Revenue Beats and Strengthens After Hours| WEEX TradFi Daily(October 21, 2026)
On October 20, equity indexes were mixed. The S&P 500 closed slightly higher, while the Nasdaq was roughly flat. SpaceX reported third-quarter revenue of $14.58 billion and net income of $4.4 billion, both well above forecasts, and rose about 3% after hours. Bitcoin traded near $83,000, while ZEC led majors with a more-than-10% gain in 24 hours. Memory, optical and crypto-finance names rose from the prior evening, and CoreWeave and SMCI bounced off lows. Tesla, Meta and other companies report on October 21.
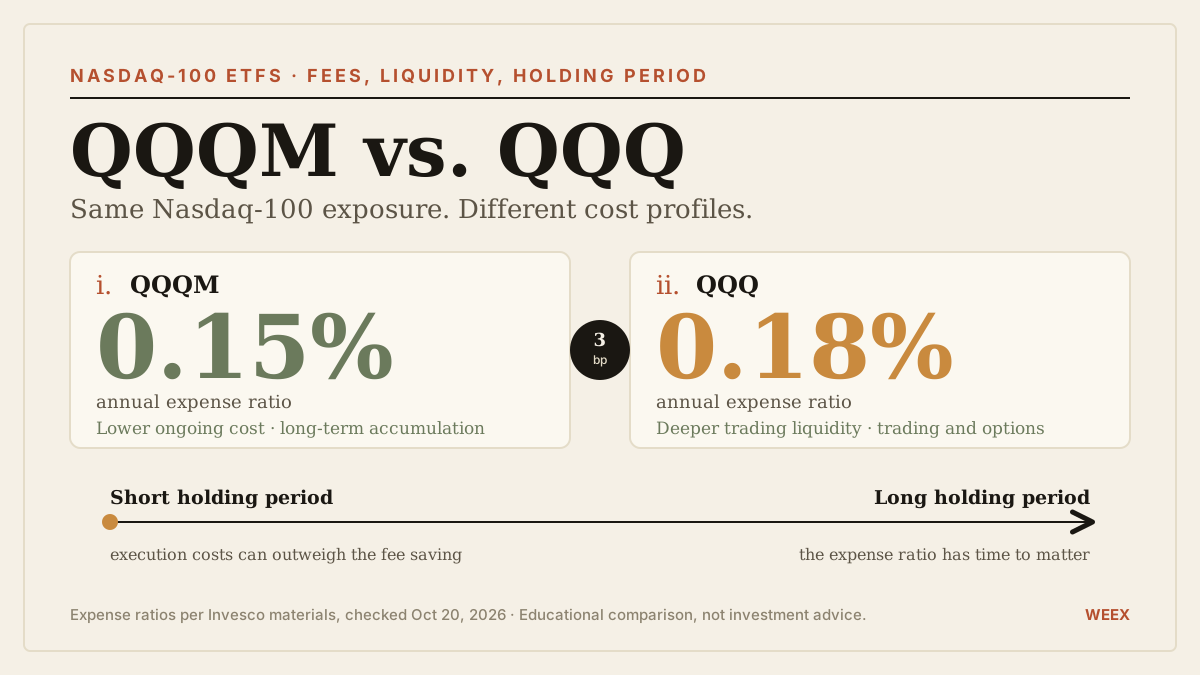
QQQM vs. QQQ in 2026: Fees, Liquidity and Long-Term Investing Compared
Compare QQQM vs. QQQ in 2026: current fees, trading costs, long-term savings, and when switching an existing investment may cost more than it saves.
Anthropic IPO Price Prediction: Where Could ANT Open After Pricing?
Anthropic IPO price prediction: See ANT’s $80–$87 base-case opening range, how the final offer price changes it, and what could push shares above $90.
Major Indexes Close Lower, Nvidia Earnings Are Imminent | WEEX Daily Market Brief (November 17, 2026)
At the November 16 close, the three major indexes all finished lower. Technology-stock selling continued, with the chip sector leading declines. Bitcoin’s weekend selloff showed signs of stop-loss hunting; it is currently around $64,000. Backpack received regulatory approval. On November 17, watch for October retail sales data and earnings from Nvidia, Home Depot, Disney, and JD.com.
Bitcoin Falls to $62,000 Over the Weekend; Rumors of Former Nvidia CEO’s Return | WEEX Daily Market Brief (November 16, 2026)
Crypto markets continued to decline amid low weekend liquidity, with Bitcoin probing lower levels. The DeFi sector rebounded first. Stock indexes showed mixed performance last week, with notable volatility in the AI sector. Anthropic is expected to list this Thursday. On November 16, watch Baidu and Trip.com earnings, as well as the execution period for the Coinbase CEO’s stock sale plan.
NVDA Earnings, Retail Sales and FOMC Minutes | WEEX Weekly Market Hotspot Preview (2026.11.16-11.20)
WEEX’s weekly market hotspot preview focuses on retail sales, Microsoft Ignite, NVDA earnings, FOMC minutes, WMT and PANW earnings, final consumer sentiment, and the ZRO unlock. After another volatile stretch for AI trades, markets will reprice AI demand, consumer resilience, rate expectations, and crypto risk appetite, putting QQQ, BTC, ETH, NVDA, MSFT, HD, WMT, PANW, and ZRO in focus.
Nvidia Stock After Hours: Jensen Huang Resigns After Affair Reports. What’s Next for NVDA Under Colette Kress?
Nvidia fell 4.34% after Jensen Huang resigned, then rose 0.98% after hours. See what Colette Kress’s appointment means for NVDA and November 17 earnings.
Nvidia CEO Resignation Impacts Tech Stocks; Bitcoin Falls to $70,000 Support | WEEX Daily Market Brief (November 13, 2026)
Technology-stock selling pushed Bitcoin down to the $70,000 support level, while Ethereum briefly fell below $2,000. Spot Bitcoin ETFs recorded net outflows for the fifth consecutive trading day. Nvidia CEO’s resignation triggered sharp share-price volatility. Nebius’s full-year guidance missed expectations. The October PPI is the key release to watch on November 13.
Latest articles
Latest coin listings on WEEX


