
How to Read a Bitcoin Short-Liquidation Map

 Prefer us on Google
A WEEX news headline dated September 7, 2026 linked a possible Bitcoin move through $79,959 with aggregate short-liquidation intensity of $1.573 billion on major centralized exchanges. This is a conditional market calculation in a news item, not a promise about price direction. This evergreen guide explains how to read such maps and figures.
Liquidation does not mean an exchange took funds without a rule. In a futures contract, collateral supports a position. If losses reduce available margin below the required level, the venue forcibly reduces or closes the position under its procedure. An aggregator’s total combines separate events and is not the loss of one trader.
How to read a BTC liquidation map after $79,959
What a short position is
A trader in a short position benefits when the underlying price falls and loses when it rises, all else equal. The position is opened with margin, while leverage allows control of a larger notional amount with less collateral. As a result, even a small move against the position can rapidly reduce its margin buffer.
If shorts are concentrated near one level, a rise can trigger their forced closing in sequence. Closing a short generally requires buying the contract or underlying asset, which can add demand during the move. This is called a short squeeze, but liquidation activity does not guarantee that a rise will continue.
What the $1.573 billion figure means
The headline gives aggregate short-liquidation intensity if BTC passes $79,959. Read this as an estimate of positions potentially exposed within a defined range and under defined assumptions, not as an exact bill that will be charged in the future.
Aggregators collect data from multiple venues. They can differ in time window, instruments, settlement currency, rounding rules, and transmission delay. The same position may appear on different scales, while public statistics do not reveal every hidden risk. Always check the snapshot time and the service’s methodology.
Why a map level is not a forecast
A liquidation map identifies areas where forced closing could occur under particular parameters. It does not know whether a trader keeps the position, adds margin, or changes leverage. Contract price and index price can also differ, and a venue commonly uses mark price to reduce the effect of a single last-trade spike.
For example, official Binance Futures material describes liquidation as the margin balance falling below maintenance margin and uses mark price in the process. Another exchange may use different formulas, risk tiers, and execution steps. A figure from one map cannot be applied to a specific position without checking that venue’s rules.
How the forced-close sequence works
- The index and mark prices move with the market.
- Unrealized loss reduces the position’s margin balance.
- When maintenance margin is breached, the venue starts its liquidation process.
- The system closes or reduces the position through its prescribed mechanism.
- The executed event reaches public statistics with a delay and venue-specific parameters.
This sequence explains why two maps published minutes apart can show different zones. It also explains why a “liquidation wall” is not a guaranteed support or resistance level.
What a reader should check
Before using futures, review access rules, settlement currency, minimum margin, fees, funding rate, mark price, and partial-liquidation procedures. Find out how the venue warns about risk and what happens to a remaining position. Regional restrictions and the laws that apply to you also matter.
Do not increase leverage merely because a map shows a large cluster. The map may be incomplete or stale. Position sizing, isolated margin, and a predetermined loss limit can reduce the scale of an error but cannot remove it. Test the calculation on a small practice position and do not use an aggregator as the only source.
What to monitor after publication
To review the story, record the snapshot time, data source, BTC level, and range described by the aggregator. Compare actual events across venues and distinguish liquidations from ordinary position closures. Open interest, volume, and funding rate add context, but one indicator does not establish price direction.
The $79,959 level in the headline is the historical condition attached to that news item, not a current signal for September 16, 2026. The durable lesson is why leverage and concentrated positions can amplify a move, and which data should be checked before a trade.
Why position size matters more than an impressive map
The same level can be critical for a position with little margin buffer and irrelevant to an unleveraged position. A map therefore cannot tell a specific person how much money will be lost. It only shows where potential risks may cluster under stated assumptions. Position size, entry price, margin mode, and added collateral all change the outcome.
It is useful to decide in advance what share of capital is exposed and to write down conditions for stopping. That is risk discipline, not a method for forecasting the market. Even accurate aggregator data may execute differently because of slippage, delay, and incomplete liquidity.
Separating scale from outcome
A billion-dollar figure attracts attention, but it does not show how many orders executed or at what price. A retrospective check needs a timestamp, venue list, and the data provider’s definition of liquidation. If one element is missing, the safer description is a news estimate rather than a measured outcome.
Continue: read the LUSD protocol-attack review for how liquidity can be drained; broader Bitcoin context is available in this historical BTC-price overview.
This material is for information only and is not investment, financial, legal, or tax advice. Leveraged trading can result in rapid loss of funds.
This content is provided for general informational purposes only and doesn't constitute financial, investment, legal, or tax advice. Any events, rewards, online promotions, or related information mentioned herein should not be considered a recommendation, solicitation, or invitation to purchase, sell, trade, or otherwise deal in any crypto assets. Crypto assets are highly volatile and may result in loss. The availability of WEEX services, products, and related events may vary by region. You are responsible for ensuring that your participation is in accordance with applicable local laws and regulations.
You may also like

What the Grok 4.7 Announcement Means for Users

What the LUSD Attack Shows About DeFi Risk

Shiba Inu (SHIB): What to Check Before Trading on WEEX

SEI: The Trading-Focused Blockchain and Its Token on WEEX
RENDER: The Render Network Token and Trading on WEEX

New Coins on WEEX: How to Check Listings, Pages and Risks
Lisk Chain Shutdown October 31: How to Move LSK Safely
Grok 4.7 Explained: How to Check Release and Performance Claims
What Is BONK? WEEX Spot and 1000BONK Futures Status and Risk Checks

What Is BRETT? WEEX Spot and Futures Status and Risk Checks
What Is FLOKI? WEEX Spot and 1000FLOKI Futures Status and Risk Checks
What Is WIF (dogwifhat)? WEEX Spot and Futures Status and Risk Checks
JPEX Case Retrial: What Taiwan Crypto Users Should Check
Grok 4.7 Release Claims: A Taiwan User Verification Guide
Is WEEX Legal in Taiwan? FSC VASP Rules and the Public Register

WEEX Reviews in 2026: App Ratings, Incidents and How to Read Them

Pump.fun (PUMP) Price Prediction: Attributed Scenarios, Tokenomics and Risks

Is SafePal Safe? A Look at Its Security Features
How to Set Up and Use SafePal Wallet?
Meme coin 龙虾 ($LOBSTER) Surges Past $200M: What’s Behind the Rally?
What Is SafePal Wallet? A Complete Beginner's Guide
What Is ArithFi (ATF)? Why It Is Not Listed on WEEX
What Is Block Street (BSB)? Tokenomics, Listings and the Unified Liquidity Layer
What Is Bitway (BTW)? Product, Tokenomics and the January WEEX Listing
What Is CHIP? USD.AI Governance, Tokenomics and the Ticker Collision
What Is Genius Terminal (GENIUS)? Product, Tokenomics and Trading Risks
What Is Janction (JCT)? AI Layer 2, Tokenomics and Risks
What Is Nexus (NEX)? The Verifiable-Computing Network, Tokenomics and Outlook
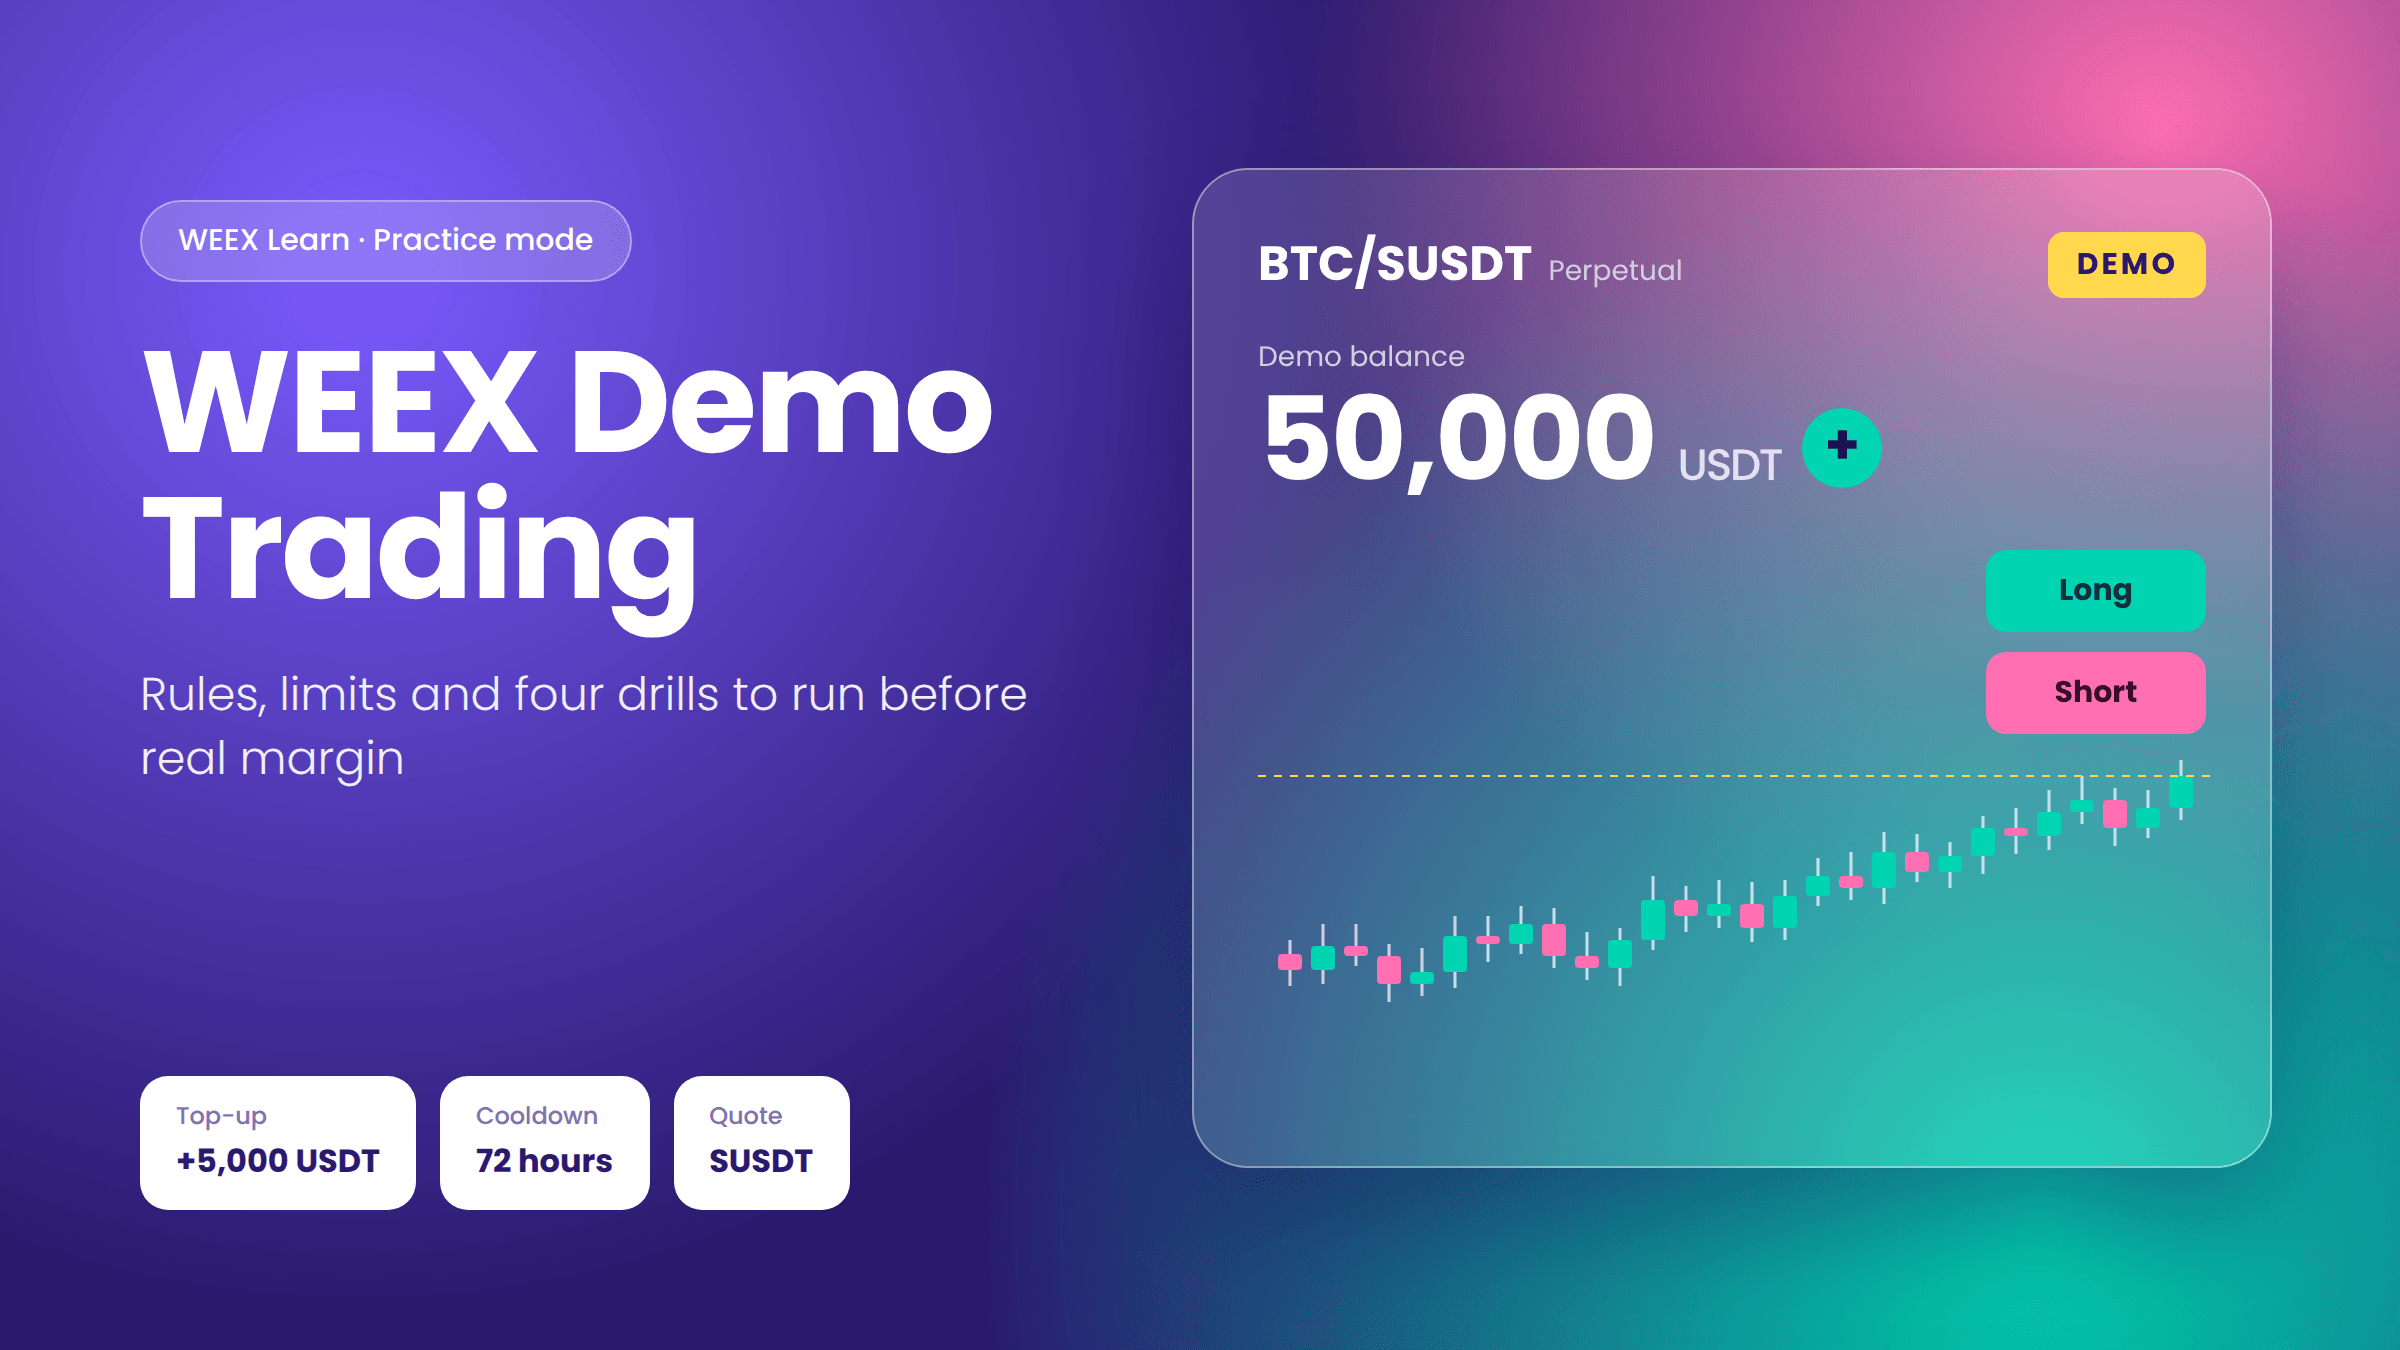
WEEX Demo Trading: 50,000 USDT Practice Account, Rules and Limits
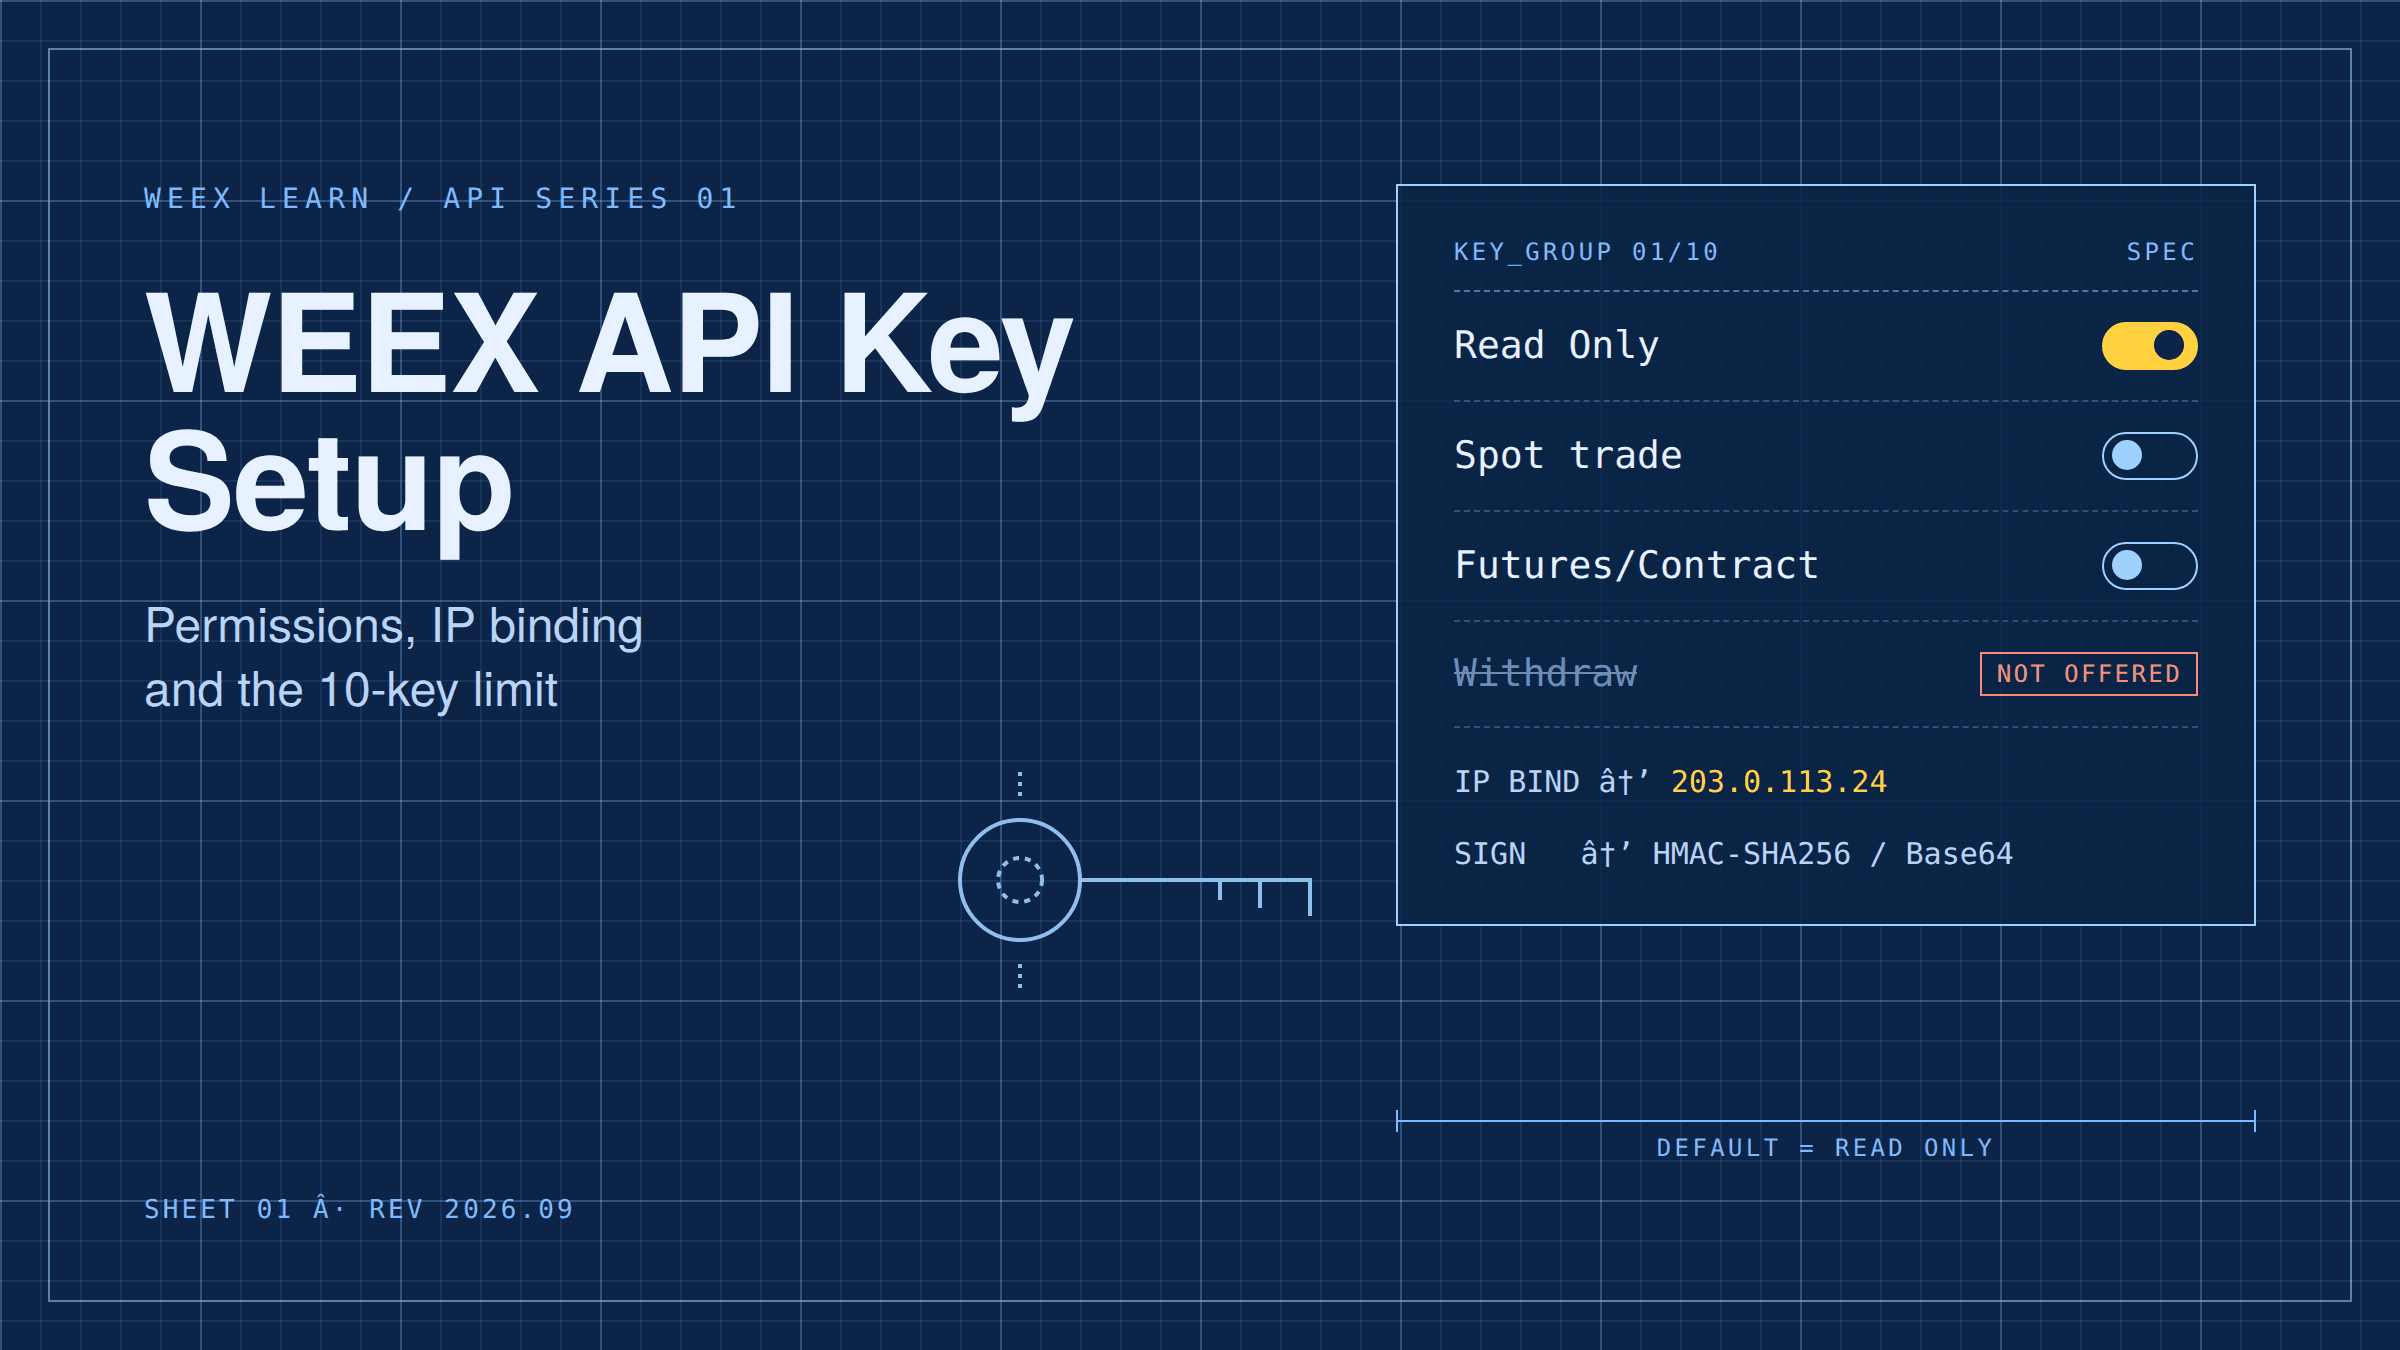
WEEX API Key Setup: Permissions, IP Binding and Key Limits
What the Grok 4.7 Announcement Means for Users
What the LUSD Attack Shows About DeFi Risk
Shiba Inu (SHIB): What to Check Before Trading on WEEX
SEI: The Trading-Focused Blockchain and Its Token on WEEX
RENDER: The Render Network Token and Trading on WEEX
New Coins on WEEX: How to Check Listings, Pages and Risks


