
Iran Crisis and Stock Markets: Which Sectors Win and Which Lose?

 Prefer us on Google


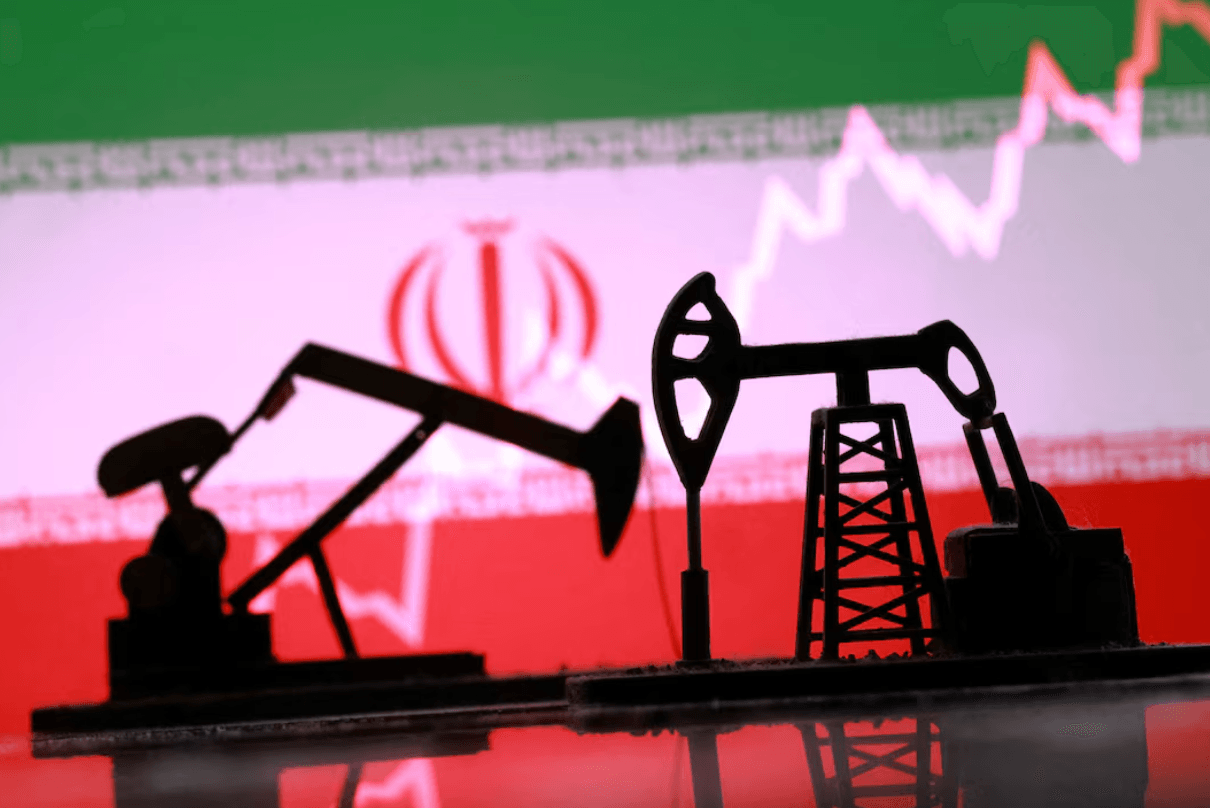
Oil price spikes do not hit all stocks equally. The Iran crisis that has kept oil elevated through most of 2026 has produced a sector rotation that is more nuanced than the simple energy-up everything-else-down narrative that dominates most oil shock coverage. Understanding which specific sectors benefit, which face sustained pressure, and which produce counterintuitive outcomes is more useful for portfolio positioning than a generic risk off framework.
The current crisis has also produced some unusual sector dynamics that previous oil shock episodes did not generate, primarily because the 2026 geopolitical environment combines Middle East energy disruption with an AI infrastructure spending boom that creates demand patterns in the energy sector that were not present in previous cycles.
The Clear Winners: Energy Producers and US LNG Exporters
The most direct beneficiary of any oil price spike is the upstream energy sector, the companies that extract oil and natural gas from the ground and sell it at market prices.
When Brent crude rises from $70 to $79 in a matter of days, an oil producer whose extraction cost is $25 per barrel sees its margin expand from $45 to $54 per barrel, a 20% margin improvement without any change in production volumes, capital expenditure, or operational efficiency. That mechanical leverage to oil prices is what makes upstream producers the most reliable sector winner in any oil price spike regardless of cause.
The Iran crisis specifically benefits US producers more than most historical oil shocks because it creates substitution demand that flows directly to American LNG and crude exports. Countries that previously sourced significant volumes from Persian Gulf producers through the Strait of Hormuz, including Japan, South Korea, and India, have been actively diversifying their supply toward US LNG during the disruption. That substitution adds incremental demand for US production that sits on top of normal domestic consumption, which means US producers are not just benefiting from higher prices but also from higher volumes at those higher prices.
The oilfield services sector benefits one step removed from the producers. When sustained high oil prices make development of new reserves economically attractive, producers increase drilling activity and production investment, which flows through to the companies providing drilling equipment, completion services, and production maintenance. The lag between oil price increases and oilfield services demand is typically two to four quarters, which means the services companies are still in the early stages of benefit recognition from the 2026 crisis.
The Surprising Winner: US Defense Contractors
One sector that benefits from the Iran crisis in ways that oil shock analysis typically overlooks is US defense contractors.
Every military strike that US Central Command executes against Iranian targets requires precision munitions, surveillance assets, electronic warfare equipment, and the logistical infrastructure that US defense companies provide. The approximately 90 Iranian targets struck in today's operations represent real and immediate revenue for the companies that manufactured the missiles, drones, and support systems used in those strikes.
Beyond the immediate munitions expenditure, the Iran crisis has accelerated defense procurement decisions across NATO and allied nations that were already increasing defense budgets in response to the broader geopolitical environment. The combination of Middle East instability, European security concerns, and Indo-Pacific tension has created a defense spending environment that is the most favorable for US contractors in decades.
Lockheed Martin, RTX, Northrop Grumman, and General Dynamics are the primary beneficiaries of this spending environment. Their order books reflect not just the immediate Iran conflict but the multi-year procurement cycles that crises of this type typically initiate. A country that realizes its air defense systems or precision strike capabilities are inadequate during a period of regional conflict places orders that take years to fulfill, creating revenue visibility for defense contractors that extends well beyond the crisis that generated the initial demand.
The Clear Losers: Airlines and Consumer Transportation
Airlines face the most direct and immediate margin pressure from oil price spikes because jet fuel represents 20% to 30% of their total operating costs and cannot be immediately passed through to ticket prices without demand destruction.
The specific mathematics of airline fuel exposure during the Iran crisis are worth understanding precisely. When Brent crude rises from $70 to $79, jet fuel prices follow with approximately a 70% to 80% correlation, meaning a roughly $6 to $7 per barrel increase in jet fuel costs. A major airline operating 500 aircraft at typical fuel burn rates consumes millions of barrels of jet fuel annually, which means a $6 to $7 per barrel cost increase translates into hundreds of millions of dollars of additional annual costs without any revenue offset.
Airlines hedge their fuel costs, which provides partial protection over the period covered by existing hedges. But hedges have finite duration, and sustained high oil prices eventually flow through to unhedged positions as hedges roll off. Airlines that entered the Iran crisis with relatively short hedge durations have been feeling the pain most acutely through mid-2026. Airlines with longer hedge positions have been watching the impact approach but not yet fully arrive.
The cruise industry faces similar fuel exposure to airlines without even the ticket price flexibility that business travel provides. Cruise operators negotiated their itinerary prices months in advance, their fuel consumption is enormous for the large vessels involved, and their passenger base is highly price sensitive. A sustained $10 per barrel increase in oil prices can eliminate the entire profit margin on a cruise itinerary that was priced when oil was $20 per barrel lower.

The Complicated Middle: Refiners and Petrochemicals
Refiners occupy the most counterintuitive position in the oil price shock sector analysis because their profitability depends not on the absolute level of oil prices but on the relationship between crude oil input costs and refined product output prices, a metric called the crack spread.
When a geopolitical disruption affects crude supply specifically, refined product prices can rise faster than crude prices if the disruption creates regional product shortages rather than affecting refined product flows equally. In that scenario, the crack spread widens and refiners actually benefit from the same oil price spike that hurts airlines and consumers. This is the scenario that tends to prevail in the immediate aftermath of a supply disruption, when crude grades from the affected region become scarce but refinery utilization elsewhere can temporarily meet refined product demand.
Over longer periods, when crude price increases fully pass through to refined product prices and the crack spread normalizes, refiners lose the temporary benefit and face the same margin pressure as any energy-intensive business. The timing of when a refiner's crude purchasing contracts reprice relative to when its refined product sales contracts reprice determines whether any given quarter sees benefit or pressure from an oil price spike.
Petrochemical companies face a cleaner and more consistently negative relationship with oil price spikes. Their primary feedstock is naphtha and natural gas liquids that price off crude oil, while their product prices respond more slowly to input cost changes because of the competitive dynamics of the specialty chemicals market. Higher feedstock costs that cannot be immediately passed through compress margins in ways that can last for multiple quarters.
The Interest Rate Channel: How Oil Hits Banks and Financials
One sector whose connection to oil price spikes is frequently overlooked but has been one of the more important dynamics in the 2026 Iran crisis is the financial sector, particularly banks.
The transmission mechanism runs through inflation and interest rate expectations rather than through any direct oil price exposure. When oil prices rise and sustain at elevated levels, inflation expectations increase. Central banks that were planning to cut interest rates find themselves in a more complicated position. Rate cuts that seemed certain become conditional on inflation returning to target, which oil price spikes complicate.
In the current environment, today's oil price jump has pushed the US two-year Treasury yield to its highest level since February 2025, reflecting the market's repricing of rate cut expectations. That rate repricing affects bank profitability in complex ways. Banks with significant floating-rate loan books benefit from higher rates because their interest income rises. Banks with large fixed-rate mortgage portfolios or bond portfolios can face mark-to-market pressure as rates rise.
The net effect on the banking sector from oil price spikes is therefore ambiguous and depends on individual bank balance sheet composition rather than producing a uniform sector directional move. This is why the financial sector does not appear cleanly in either the winners or losers column of standard oil shock sector analysis, despite being one of the sectors most affected by the interest rate channel that oil price spikes create.
The AI Infrastructure Wildcard That Makes 2026 Different
One sector dynamic that makes the 2026 Iran oil crisis different from previous oil shock episodes is the interaction between energy price elevation and AI data center demand for electricity.
AI data centers consume extraordinary amounts of electricity. The expansion of AI infrastructure by Microsoft, Meta, Google, Amazon, and numerous hyperscalers has created electricity demand growth that is straining grid capacity in multiple US regions. Natural gas, which is the marginal electricity generator in most US markets, is priced closely with oil. When oil prices rise, natural gas prices tend to follow, which increases the electricity costs for data center operators.
This creates a specific and novel pressure on technology companies that is separate from the interest rate channel. The capital expenditure required to build AI data centers is enormous. The operating costs of running those data centers, primarily electricity, are also substantial. When oil and gas prices rise, the operating cost structure of the AI infrastructure buildout becomes more expensive, which affects the financial models of companies making hundred-billion dollar commitments to data center expansion.
Microsoft, Meta, and Amazon have all disclosed extraordinary data center capex commitments in 2026. The Iran oil crisis adds an energy cost variable to those commitments that was not in the original planning assumptions. Whether that additional cost is material enough to affect investment decisions is not yet clear from public disclosures, but it is a novel channel through which oil prices affect the technology sector in 2026 that did not exist at comparable scale in previous oil shock episodes.
The Geographic Dimension That Changes the Analysis
One final dimension that the standard sector analysis misses is the geographic concentration of winners and losers that the specific geography of the Iran crisis creates.
US-based energy producers, defense contractors, and LNG infrastructure companies are the primary winners. The economic benefits of higher oil prices and substitution demand flow primarily to US entities, which is why US equity indices have been more resilient to the Iran crisis than Asian equity indices.
Asian equity markets, particularly South Korea, Japan, and India, concentrate the losers. Their domestic energy companies are primarily distributors rather than producers, meaning higher oil prices represent a cost rather than a revenue opportunity. Their manufacturing sectors face higher energy input costs. Their currencies face devaluation pressure as energy import bills grow. The KOSPI circuit breakers that have become a recurring feature of 2026 are partly a function of this geographic concentration of the oil price shock's negative impact.
For global investors, this geographic dimension means that sector positioning alone is insufficient. The same sector, say consumer discretionary, performs very differently in the US context where oil income supports consumer spending in energy-producing states versus the South Korean context where oil costs compress consumer purchasing power nationally.
For those looking to participate in global financial markets, having access to the right trading platform matters. WEEX offers crypto and stock trading products, covering major global markets including US stocks and digital assets.
Conclusion
The Iran crisis sector impact is more nuanced than the energy-up everything-else-down framework that dominates surface-level analysis. Energy producers and US LNG exporters win directly and immediately. Defense contractors win through munitions expenditure and procurement acceleration. Airlines and cruise operators lose through fuel cost pressure. Refiners and petrochemicals face complicated and timing-dependent impacts. Banks and financials are affected through the interest rate channel rather than directly.
The 2026 crisis introduces novel dynamics that previous oil shock analysis did not need to address, particularly the interaction between energy prices and AI data center electricity costs, and the geographic concentration of winners in the US and losers in Asia that reflects the specific supply disruption geography of the Strait of Hormuz.
Portfolio positioning during the Iran crisis requires understanding both the sector and the geographic dimensions of the oil price shock simultaneously. Getting the sector right in the wrong geography still produces the wrong outcome.
FAQ
1. Which sectors benefit most from the Iran oil crisis?
US upstream energy producers benefit most directly through higher oil prices and substitution demand from countries previously sourcing from Persian Gulf suppliers. US defense contractors benefit through munitions expenditure and accelerated procurement. US LNG exporters benefit through incremental volume demand from Asian buyers diversifying away from Strait of Hormuz-dependent supply.
2. Which sectors are hurt most by the Iran oil crisis?
Airlines and cruise operators face the most direct and immediate margin pressure through higher jet fuel costs representing 20% to 30% of operating costs. Consumer discretionary companies in oil-importing nations face reduced consumer spending power. Technology companies with large data center electricity consumption face higher operating costs through the natural gas price channel.
3. Why do Asian stock markets fall more than US markets during Iran oil price spikes?
Asian economies including South Korea, Japan, and India are heavily oil-import dependent, meaning higher oil prices represent a national economic cost rather than a revenue opportunity. Their domestic currencies weaken against the dollar as energy import bills grow. Their manufacturing sectors face higher energy input costs. The geographic concentration of oil shock damage in Asia versus benefits in the US produces systematically different equity market impacts.
4. How does the Iran crisis affect bank stocks?
Banks are affected through the interest rate channel rather than through direct oil exposure. Higher oil prices elevate inflation expectations, which complicates central bank rate cut plans. Banks with floating-rate loan books benefit from higher rates while banks with large fixed-rate portfolios face mark-to-market pressure. The net sector impact depends on individual bank balance sheet composition rather than producing a uniform directional move.
5. What makes the 2026 Iran crisis different from previous oil shocks for stock markets?
The interaction between elevated energy prices and AI data center electricity demand is a novel channel that did not exist at comparable scale in previous oil shock episodes. Major technology companies have committed hundreds of billions to data center expansion whose operating costs include substantial electricity bills that rise when oil and natural gas prices increase. This creates a technology sector energy cost pressure that was not present in the 2008 or 2014 oil price shock episodes.
Disclaimer
For informational purposes only. Not financial advice. Any activities, rewards, campaigns, or promotions mentioned do not constitute an offer, solicitation, or recommendation to buy, sell, or trade crypto assets. Crypto assets are highly volatile and may lose value. WEEX services, products, or campaigns may not be available in all regions. Users are responsible for complying with applicable local laws before participating.
Disclaimer: This content is provided for general branding and informational purposes only and doesn't constitute financial, investment, legal, or tax advice. Any events, rewards, online events, or related information mentioned herein should not be considered a recommendation, solicitation, or invitation to purchase, sell, trade, or otherwise deal in any crypto assets or to use any services. Crypto assets are highly volatile and may result in loss. WEEX services and online events may not be available in all regions and are subject to applicable laws, regulations, and eligibility requirements. You are responsible for ensuring that your use of WEEX services complies with local laws and for carefully assessing the risks before participating in any crypto-related activities.
You may also like

Introducing Cash Cat ($CASHCAT): Robinhood Chain Meme Token and Price Prediction
Cash Cat is a Robinhood Chain meme token drawing attention after a fast market debut, a 1B supply, and sharp price swings.

LLY Stock Forecast: Can AI and Weight Loss Drugs Drive More Growth?
This article maps how Eli Lilly’s GLP-1 weight-loss franchise and AI-driven R&D could influence LLY’s traditional equity and…

CASHCAT Airdrop: How to Earn Up to 50,000 USDT in Rewards on WEEX
This guide breaks down how the CASHCAT Airdrop works on WEEX, the rewards on the table, and a…
What Is SOXS ETF? The 3X Bear Semiconductor ETF Explained
This guide breaks down SOXS—the Direxion Daily Semiconductor Bear 3X Shares—so you understand what a 3x inverse semiconductor…
Trust Wallet Transaction Stuck or Failed? Here's How to Fix It
A stuck or failed transaction in Trust Wallet is one of the most common problems crypto users encounter and one of the most misunderstood. The cause is almost always related to gas fees or network congestion rather than anything wrong with your wallet. This guide explains why transactions get stuck or fail, how to fix each situation, and how to prevent it from happening again.

Trust Wallet vs MetaMask: Which One Is Better for Beginners?
Trust Wallet and MetaMask are the two most widely used self-custody crypto wallets in the world. They serve different primary purposes and suit different types of crypto users. This guide compares them directly on the dimensions that matter most for beginners making their first wallet choice.

Trust Wallet Seed Phrase: How to Store It Safely and What Never to Do
Your Trust Wallet seed phrase is the single most important piece of information associated with your crypto holdings. Every security measure in the world is irrelevant if your seed phrase is compromised. This guide focuses entirely on storage methods, the specific mistakes that lead to loss, and the habits that protect your seed phrase over the long term.

O Airdrop for New Users: Earn USDT Rewards on WEEX
New to trading O and looking for USDT rewards? This guide explains how the WEEX O Airdrop for…
How to Install Trust Wallet Safely: What Most Guides Leave Out
Most Trust Wallet installation guides tell you where to download the app and how to save your recovery phrase. Few explain the specific mistakes that result in lost funds, compromised wallets, and successful phishing attacks during the setup process. This guide focuses on what those other guides skip.

Samsung Stock vs SK Hynix Stock: Which Korean Memory Giant Is the Better Buy Right Now?
Samsung stock and SK Hynix stock are the two largest memory companies in the world and the two dominant forces in the AI memory boom of 2026. This guide compares the two specifically on the variables that matter for the buy decision rather than on company history or general descriptions.
What Is Trust Wallet? A Complete Beginner's Guide
Trust Wallet is a self custody crypto wallet used by more than 200 million people across more than 100 blockchains. This guide explains what Trust Wallet actually is, how it works, what is new in 2026, and what beginners need to know before using it.
Is Samsung Stock a Buy After Falling 15% From Its All Time High?
Samsung stock is trading approximately 15% below its all time high despite reporting the highest quarterly operating profit ever recorded by a technology company. This guide focuses on the buy decision specifically, examining what the 15% discount actually represents and whether the business case justifies buying at current levels.
How to Buy Samsung Stock: What Non-Korean Investors Need to Know
Samsung Electronics has no US-listed ADR and no direct equivalent to SKHY on any major Western exchange. Non-Korean investors who want Samsung exposure have four main options, each with different cost structures, accessibility levels, and risk profiles. This guide explains each option precisely and what the tradeoffs actually are.

Samsung Stock Falls 7% on Record Profit: Why 1800% Earnings Growth Was Not Enough
Samsung stock fell roughly 7% on July 7 after reporting Q2 operating profit of approximately $58 billion, a 19 fold increase from the same quarter a year earlier. The result beat analyst estimates. The stock fell anyway. This guide explains the specific mechanism that produced that outcome and what it means for investors watching the July 30 full earnings report.

Why Oil Prices Are Rising Again: The Iran Hormuz Crisis and What It Means for Your Portfolio
Oil prices surged more than 3% after the US and Iran exchanged fresh strikes and issued conflicting statements about whether the Strait of Hormuz remains open. Brent crude climbed toward $79 a barrel. This guide explains what the Strait of Hormuz crisis actually is, why it moves oil prices, and what the current escalation means for different parts of an investment portfolio.
Bitcoin and the Iran Crisis: Does Crypto Act as a Safe Haven When Oil Spikes?
Oil prices surged more than 3% on July 13 after fresh US-Iran strikes raised new questions about Strait of Hormuz access. Bitcoin and crypto markets responded with characteristic ambiguity. This guide examines whether crypto genuinely acts as a safe haven during oil price shocks, what the historical evidence says, and what the Iran crisis specifically reveals about crypto's role in a geopolitical stress environment.
KOSPI Crash and SKHY: Why South Korean Stocks Fall While US-Listed ADRs Hold
The KOSPI fell more than 8% and triggered a circuit breaker on July 13 while SKHY held near $168 on Nasdaq. The same company's shares moving in opposite directions on two exchanges on the same day is not a contradiction. It is the result of three distinct mechanisms operating simultaneously. This guide explains each one.
What Is a KOSPI Circuit Breaker and Why Has It Triggered Seven Times in 2026?
The KOSPI circuit breaker triggered for the seventh time in 2026 on July 13, halting all South Korean stock trading for 20 minutes after the index fell more than 8%. This guide explains what the circuit breaker is, why it keeps triggering, and what it reveals about the specific structure of the Korean market.
SK Hynix Stock Price Prediction 2026–2030: Can SKHY Reach $500?
SK Hynix stock price is trading at approximately $168 after its Nasdaq debut. Getting to $500 by 2030 requires roughly 198% appreciation over four years. This guide examines what the path to $500 actually requires across four years and three independent growth drivers that operate on different timelines.

SK Hynix Stock Price History: From $40 to $168 in One Year, What Drove the Rally?
SK Hynix stock price was trading near $40 per Korean share equivalent less than a year ago. Today SKHY trades at $168 on Nasdaq after the largest foreign ADR listing in history. This guide maps what drove each phase and what it means for where SK Hynix stock price goes next.
Should You Still Buy SKHY? What SK Hynix Stock's 13% IPO Gain Tells Investors
SK Hynix stock price opened at $170 on July 10 and closed at $168.01, representing a 13% gain from the $149 IPO price. The stock is now trading under its permanent SKHY ticker after switching from SKHYV. This guide focuses on whether the 13% first day gain changes the buy decision and what the current SK Hynix stock price implies about the investment case.
SK Hynix Stock Falls 13% in Korea as SKHY Surges in the US: What Just Happened?
SK Hynix stock fell more than 13% on the Korea Exchange on Monday, triggering a circuit breaker that briefly suspended trading of the entire KOSPI index. This guide explains why the same company's shares moved in opposite directions on two exchanges simultaneously and what it means for investors holding either.

SK Hynix Stock in Korea: Price, Drivers, and How to Buy It
SK Hynix stock (KRX: 000660) is Korea's most valuable listed company on the AI memory boom. See the price, drivers, risks, and how foreign investors can buy it.
Stock Futures Explained: What They Are and How to Trade Them
Stock futures let traders lock in an index price today and preview the market open. Learn how stock futures work, how to read them, and their risks.

BATRA Stock: Price, Forecast, and How to Trade Atlanta Braves Holdings in 2026
BATRA stock explained — Atlanta Braves Holdings price, share classes, 2026 forecast, and how to trade equity exposure via tokenized stocks.
TSMC Stock (TSM): Price, 2026 Forecast, and How to Get Exposure
TSMC stock trades near $434 in July 2026. See TSM's valuation, dividend, analyst price targets, how to buy it, and the key risks before you invest.
GDWR Coin (Global Digital Water Reserve): Legit or Hype?
Is GDWR coin legit? Global Digital Water Reserve is a Solana narrative token with no water backing. See its price, supply, risks, and how to buy safely.

USOH Crypto Scam or Legit? A Complete Risk Analysis
Is USOH Crypto legit or a scam? Explore United States Oil Holdings, its tokenized oil reserve claims, on-chain data, key risks, and investment considerations.
GDWR Crypto Scam or Legit? A Complete Risk Analysis
Is GDWR Crypto legit or a scam? Learn what Global Digital Water Reserve is, review its on-chain data, risk factors, and whether the project is backed by real-world water assets.
AI Stock Outlook: Will Iran Tensions Change the Market Outlook?
Explore how Iran tensions, rising oil prices, interest rates, and Big Tech AI spending could shape the next phase of the AI stock rally.
Introducing Cash Cat ($CASHCAT): Robinhood Chain Meme Token and Price Prediction
Cash Cat is a Robinhood Chain meme token drawing attention after a fast market debut, a 1B supply, and sharp price swings.
LLY Stock Forecast: Can AI and Weight Loss Drugs Drive More Growth?
This article maps how Eli Lilly’s GLP-1 weight-loss franchise and AI-driven R&D could influence LLY’s traditional equity and…
CASHCAT Airdrop: How to Earn Up to 50,000 USDT in Rewards on WEEX
This guide breaks down how the CASHCAT Airdrop works on WEEX, the rewards on the table, and a…
What Is SOXS ETF? The 3X Bear Semiconductor ETF Explained
This guide breaks down SOXS—the Direxion Daily Semiconductor Bear 3X Shares—so you understand what a 3x inverse semiconductor…
Trust Wallet Transaction Stuck or Failed? Here's How to Fix It
A stuck or failed transaction in Trust Wallet is one of the most common problems crypto users encounter and one of the most misunderstood. The cause is almost always related to gas fees or network congestion rather than anything wrong with your wallet. This guide explains why transactions get stuck or fail, how to fix each situation, and how to prevent it from happening again.
Trust Wallet vs MetaMask: Which One Is Better for Beginners?
Trust Wallet and MetaMask are the two most widely used self-custody crypto wallets in the world. They serve different primary purposes and suit different types of crypto users. This guide compares them directly on the dimensions that matter most for beginners making their first wallet choice.